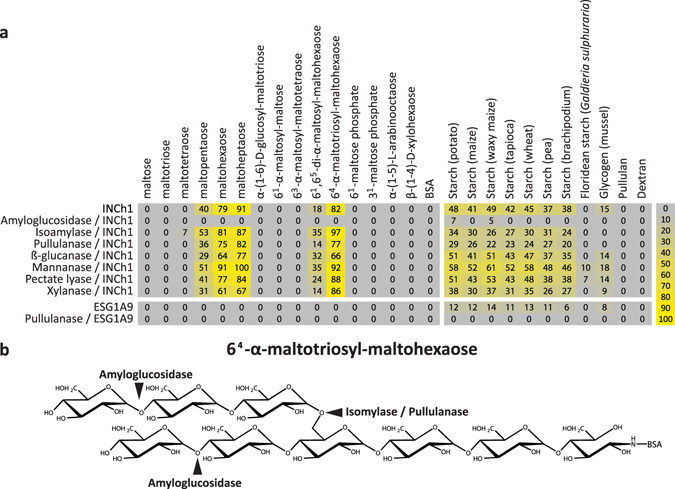
Figure 2.

INCh1 characterisation using a microarray populated with starch-related samples. (a) Heatmap showing INCh1 binding to a carbohydrate microarray populated with starch-related oligo- and polysaccharides and enzymatic epitope deletion. Note that INCh1 bound to α-(1-4)-glucan oligomers with a minimum degree of polymerisation of 4. INCh1 binding was abolished by pre-treatment of arrays with amyloglucosidase but not by isoamylase, pullulanase or any non-starch related control enzymes. Colour intensity in the heatmap is correlated to mean spot signals. The highest signal in each dataset was set to 100, and all other values were normalized accordingly as indicated by the colour scale bar. A low-end cut-off value of 5 was imposed. (b) Diagram showing the cleavage sites of the starch degrading enzymes used.
