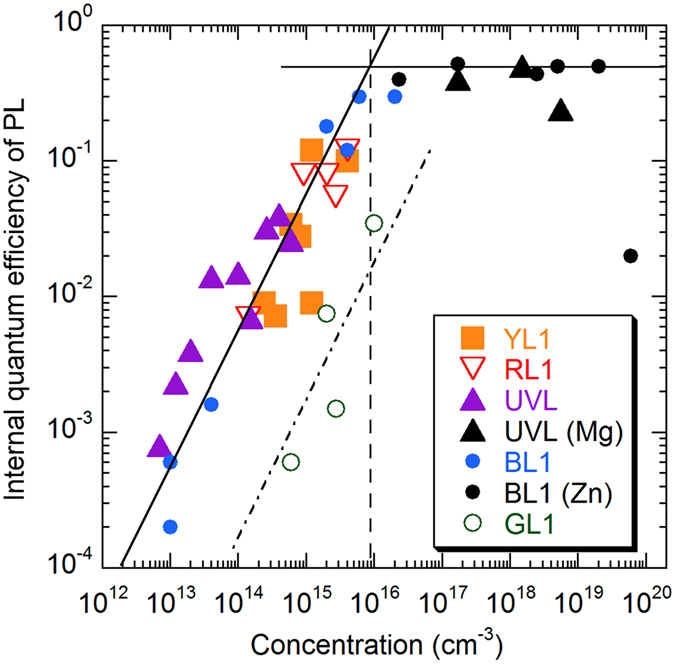
Figure 4.

Dependence of PL quantum efficiency for defect-related PL bands in GaN on the concentration of related defects. The data are from ten undoped GaN samples, six Zn-doped GaN and three Mg-doped GaN samples, all grown by HVPE. The solid lines, which are guides for eye, show a linear dependence and a saturation at the value of ~0.5. The dashed vertical line indicates the concentration of defects above which the PL intensity from dominant defects has no linear relationship with the defect concentration. The data for the GL1 band (empty circles) follow linear dependence (dash-dotted line) but lie well below the data for the dominant PL bands (RL1, YL1, BL1, and UVL), because the related defect has much lower hole-capture cross-section.
