Figure 3.

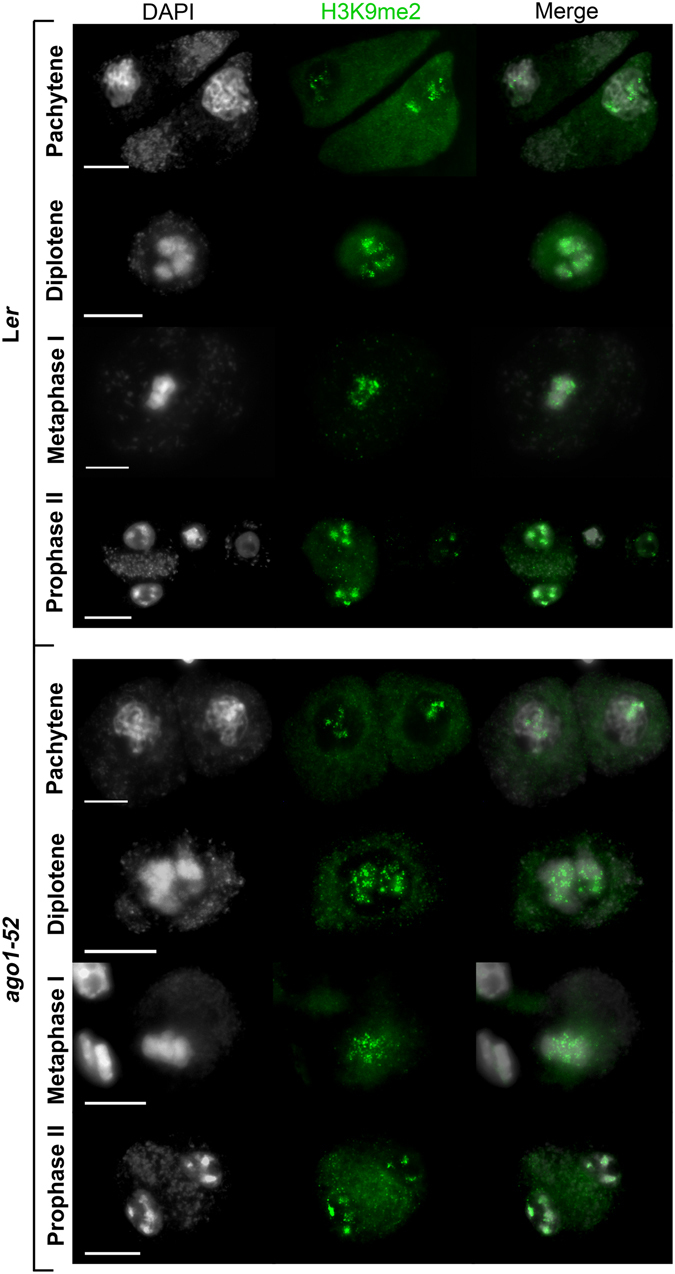
Distribution of H3K9me2 in PMCs from Ler and ago1-52. Representative images of H3K9me2 immunolocalization, which marks constitutive heterochromatic regions. Similar results were obtained with the other mutants analyzed. Bars = 5 µm.

Distribution of H3K9me2 in PMCs from Ler and ago1-52. Representative images of H3K9me2 immunolocalization, which marks constitutive heterochromatic regions. Similar results were obtained with the other mutants analyzed. Bars = 5 µm.