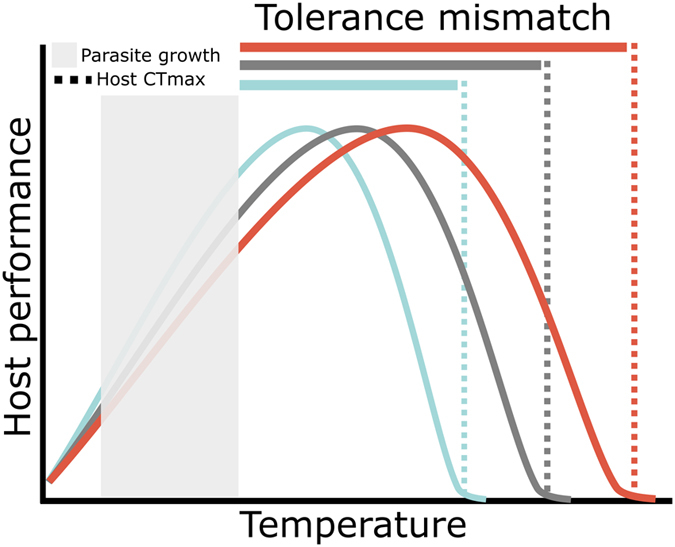
Figure 3.

The tolerance mismatch hypothesis predicts that infection risk will decrease as the difference in the thermal tolerance of the host and pathogen (tolerance mismatch) increases43. This schematic illustrates the potential effects of parasitic infection on tolerance mismatch for disease systems in which the thermal tolerance of hosts exceeds that of the parasite. Consider a host with a thermal tolerance represented by the gray dotted line. If it becomes infected, its upper thermal tolerance may be reduced (blue dotted line), decreasing tolerance mismatch (blue bar). The host is now more likely to occupy microhabitats (blue performance curve) that are favorable for the parasite, at the expense of protective thermoregulatory behaviors. In rare cases, infections might increase (red dotted line) or have no effect (gray dotted line) on thermal tolerance, thus expanding (red bar) or maintaining (gray bar) the magnitude of thermal mismatch.
