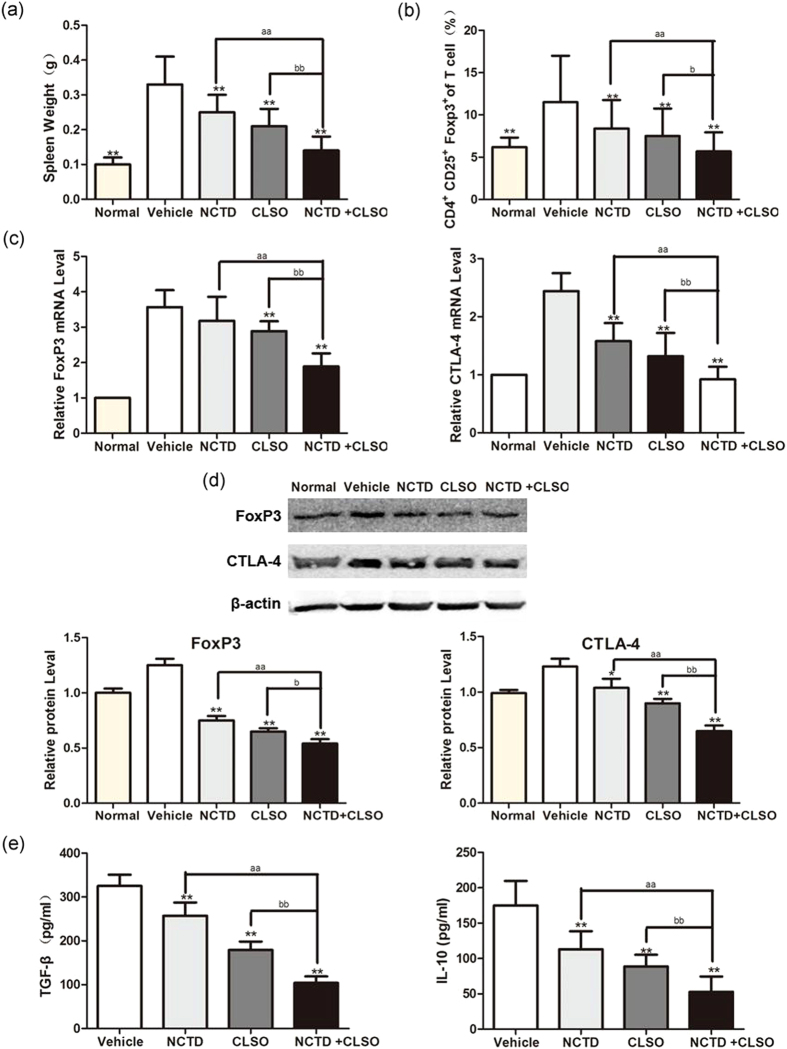
Figure 7.
Combination of NCTD with CLSO downregulates peripheral blood CD4 + CD25 + FoxP3 + Tregs in mice. (a) Isolated spleen weight from the Hepal-1 hepatoma-bearing model. (b) The peripheral blood cells were harvested, and the percentage of CD4 + CD25 + FoxP3 + cells was determined using flow cytometry. The data from the peripheral blood of mice are shown. (c) Gene expression analysis of FoxP3 and CTLA-4 of the peripheral blood of Hepal-1 mice by Quantitative Real-time PCR. The relative quantification value, fold difference, is expressed as 2−ΔΔCt. (d) The expression levels of FoxP3 in the peripheral blood samples were detected by Western blot analysis. Results represent mean values of three experiments ± SD. (e) The concentrations of TGF-β and IL-10 in the serum of mice were measured by ELISA. Data are representative of three independent experiments.*P < 0.05; **P < 0.01, vs. Vehicle, aP < 0.05; aaP < 0.01 vs. NCTD alone, bP < 0.05; bbP < 0.01 vs. CLSO alone. One-way ANOVA, post hoc comparisons, Tukey’s test. Columns, means; error bars, SDs.

