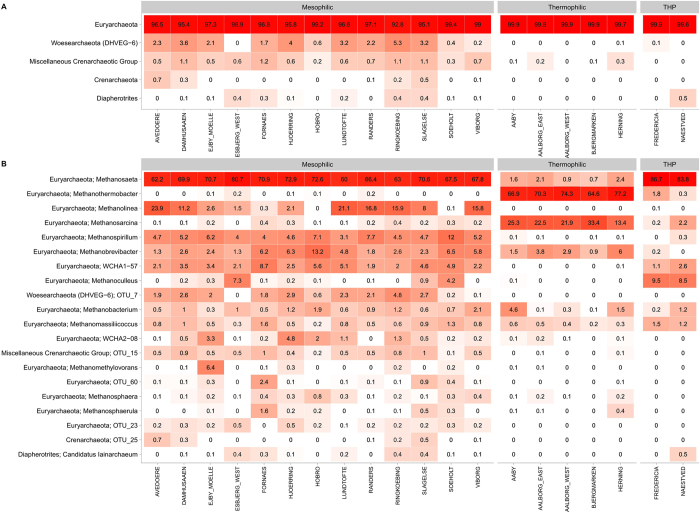
Figure 2.
(A) Heatmap of the 5 most abundant archaeal phyla. (B) Heatmap of the 20 most abundant archaeal genera in the anaerobic digesters. When no genus level classification is available the OTU number is given. The phylum level classification is shown for all genera. Data based on 32 AD reactors (1–4 per plant) analysed 2–23 times. The mean read abundance is shown for each plant. The taxa are sorted by mean read abundance across the plants at the respective phylogenetic level (phylum, genus).

