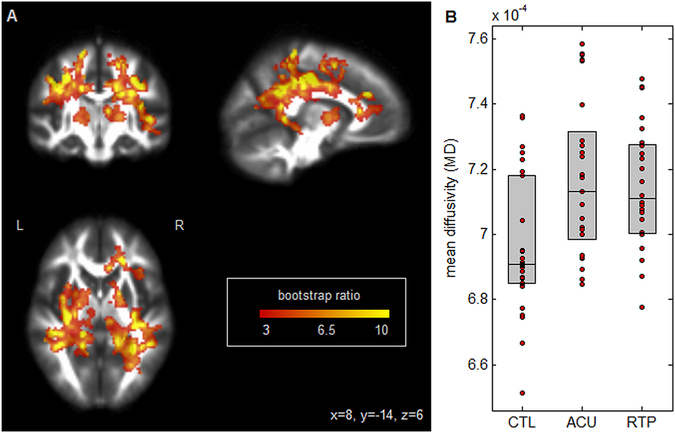
Figure 2.

(A) Brain regions where mean diffusivity (MD) shows significant differences between groups; effect sizes are reported as bootstrap ratios. Image shows maximum intensity projection (MIP) in each imaging plane, centered on the MNI coordinates (x = 8, y = −14, z = 6). (B) Average FA in significant brain regions, for control athletes (CTL) and for athletes with concussion imaged at acute injury (ACU) and at return-to-play (RTP). The boxes enclose upper and lower distribution quartiles, and middle line indicates the median. These results show elevated MD at both acute injury and RTP relative to controls, in the identified white matter regions.
