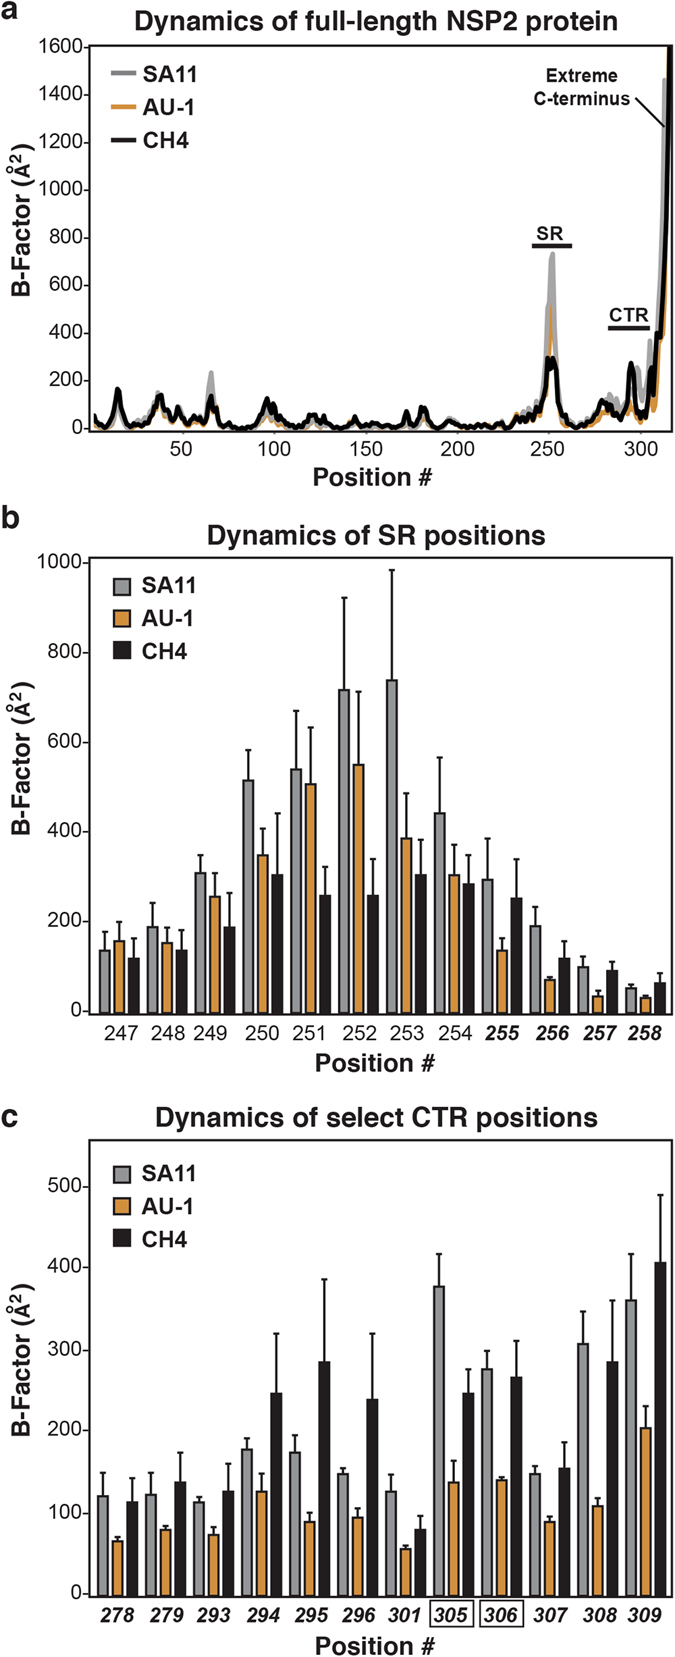
Figure 6.

Molecular dynamics simulations of NSP2 proteins. (a) Average B-factors are shown for each position of SA11 NSP2 (grey), AU-1 NSP2 (orange), and CH4 NSP2 (black). The regions corresponding to the SR, CTR, and extreme C-terminus of the NSP2 protein are labeled. Dynamics of the (b) SR positions and (c) select CTR positions. The graphs indicate relative flexibility at individual positions for SA11 NSP2 (grey), AU-1 NSP2 (orange), and CH4 NSP2 (black). Error bars represent standard deviation from the mean following 3 independent simulations. The positions numbers in bold-italic type are those in which the predicted B-factors of CH4 NSP2 are similar to those of SA11 NSP2. Positions 305 and 306 (black box outline) showed statistically-significant differences (p < 0.05) when comparing B-factors for SA11 v. AU-1 NSP2 and AU-1 v. CH4 NSP2.
