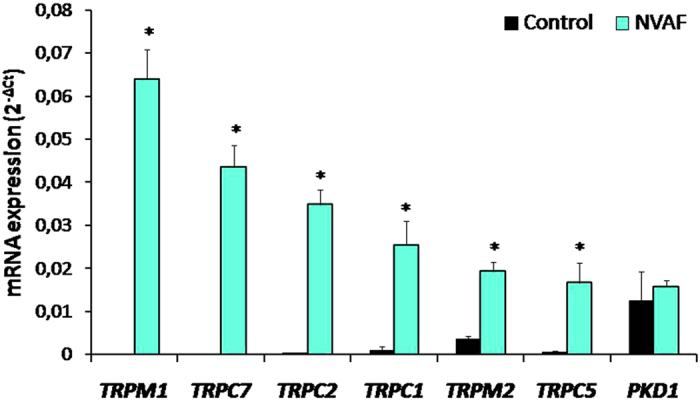
Figure 4.

Comparison of the peripheral blood mRNA TRPM1, TRPC7, TRPC2, TRPC1, TRPM2, TRPC5, and PKD1 expressions in healthy controls (n = 47, solid bars) and in patients with non-valvular atrial fibrillation (NVAF, n = 47, open bars). Values are given as mean ± SEM, *P < 0.0001, P < 0.0001, P < 0.0001, P = 0.0040, P = 0.0001, P < 0.0001, and P = 0.3083 values were obtained for TRPM1, TRPC7, TRPC2, TRPC1, TRPM2, TRPC5, and PKD1 respectively.
