
Fig. 1.
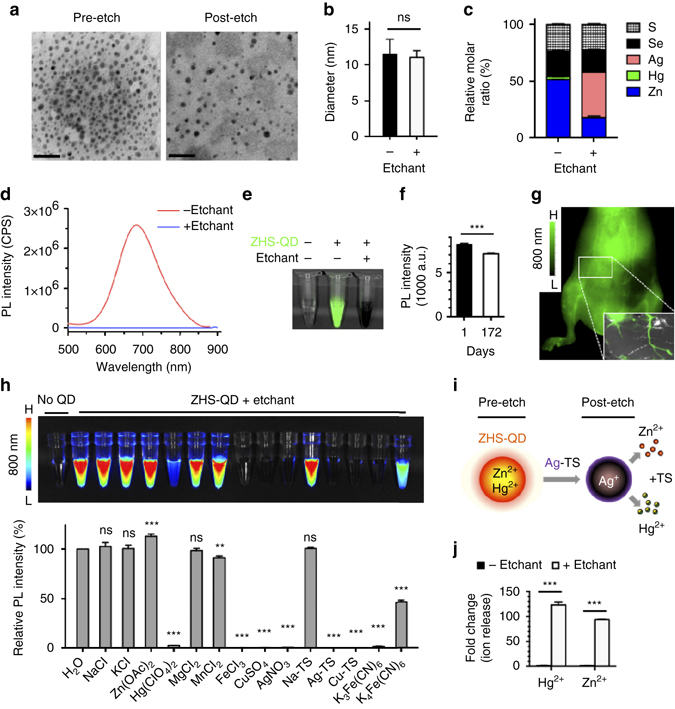
Characterization of etchable ZHS-QDs. a, b, d TEM images a hydrodynamic diameters b and PL spectra at 450 nm excitation d of ZHS-QDs before and after Ag-TS treatment. n = 6 per group; Scale bars, 50 nm. c EDS analysis of ZHS-QDs before and after Ag-TS treatment. Refer to Supplemental Table 1 for complete data set. n = 3 per group. e NIR image of ZHS-QDs (green) with and without Ag-TS treatment taken with a Li-Cor Pearl imager under an 800 nm channel. f NIR signals of ZHS-QDs quantified at days 1 and 172 post-synthesis. n = 5 per group. g NIR images of the ventral side of a mouse intravenously injected with ZHS-QDs. Inset, ex vivo NIR image of the skin. h In vitro etching of ZHS-QDs by various chemicals. NIR images (upper panel) and the emission intensity of the ZHS-QDs before and after etching (bottom panel, n = 4 per group) are shown. Each column corresponds to the tube above. i Schematic of ZHS-QD etching. Ag-TS quenches ZHS-QDs by providing Ag+ in exchange with Zn2+ and Hg2+. j Hg and Zn released from ZHS-QDs with and without Ag-TS treatment. Columns represent fold over non-etched group. n = 3 per group. Statistics, Student’s t-test b, f, j or one-way analysis of variance h; error bars, SEM; ns, not significant; **P < 0.01; ***P < 0.001