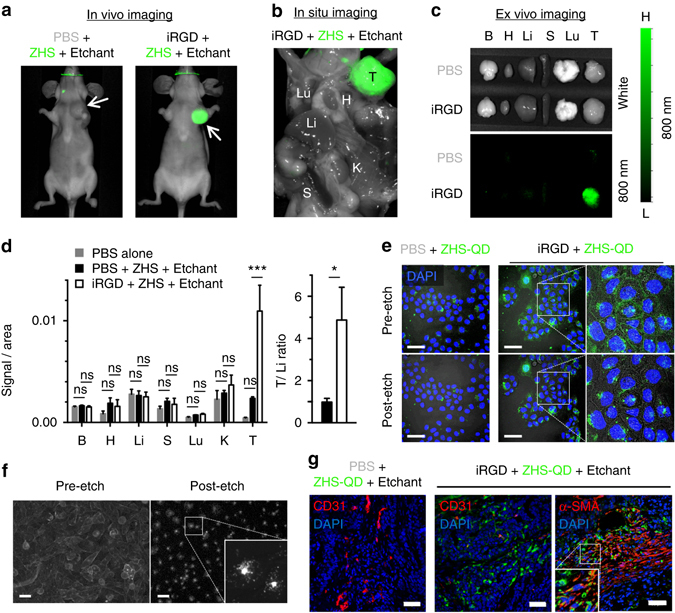
Fig. 4.

Breast tumor-specific imaging achieved by extravascular delivery of etchable ZHS-QDs. Mice bearing orthotopic MCF10CA1a human breast tumors received an intravenous injection of iRGD or PBS before an intravenous dose of ZHS-QDs. Ag-TS was given intraperitoneally. n = 4 per group. a The mice were anesthetized and imaged with a Li-Cor Pearl imager 40 min after etching. Arrows, tumors. b In situ NIR imaging of the mice after euthanasia and necropsy performed under deep anesthesia. c NIR images of collected tissues. d NIR signal per unit area in collected tissues (left panel) and T/Li ratio (right panel). B, brain; H, heart; Li, liver; S, spleen; Lu, lung; K, kidney; T, tumor. Statistics, two-way analysis of variance (left panel) or Student’s t-test (right panel); error bars, SEM; ns, not significant; *P < 0.05; ***P < 0.001. e Confocal micrographs of cultured MCF10CA1a cells treated with ZHS-QDs with or without free iRGD followed by etching with Ag-TS. Note that the QDs were internalized into the cells in the presence of iRGD, and that only the extracellular QDs were etched. Blue, Hoechst 33342; green, ZHS-QDs; scale bars, 50 μm. Insets show a magnified view of the boxed areas. f Epifluorescence micrographs of cultured PC-3 human prostate cancer cells treated with cell-penetrating QDs followed by etching with Ag-TS. PC-3 cells were incubated with CdSe/ZnS QDs coated with a cell-penetrating peptide KCDGRPARPAR. Only speckled peri-nuclear signals remain after etching. Scale bars, 50 µm. g The tumors shown in c were processed for immunofluorescence staining and subjected to confocal microscopy. Blue, DAPI; red, CD31 or α-SMA; green, ZHS-QDs; scale bars, 50 μm. The boxed area is magnified. Note that the QD signals are found in the perinuclear area of the cells
