Fig. 5.

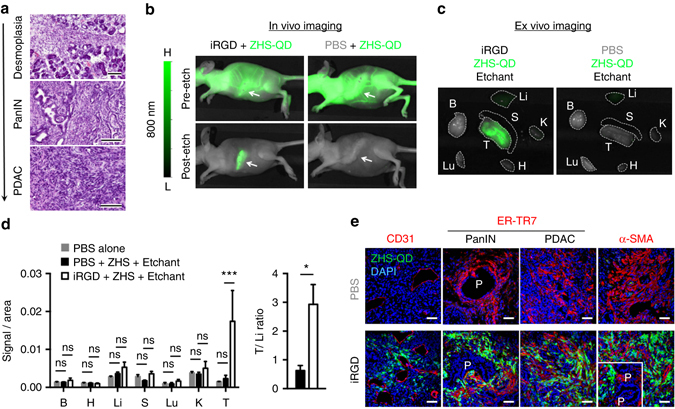
Desmoplastic PDAC imaging with etchable ZHS-QDs. a H&E staining of orthotopic KRAS-Ink tumor tissue collected from mice. A mixed histology ranging from pancreas tissue with severe desmoplasia, high-grade PanIN, to full-blown PDAC is observed. n = 3, scale bars, 100 μm. b–e Mice bearing orthotopic KRAS-Ink PDAC tumors received intravenous injections of iRGD or PBS 25 min before ZHS-QD injection. Ag-TS was intravenously injected 30 min after the QD injection. n = 3 per group. NIR images of anesthetized mice b and collected tissues c. Arrows, tumors; dotted lines, tissues. B, brain; H, heart; Li, liver; S, spleen; Lu, lung; K, kidney; T, tumor. NIR signal per unit area in collected tissues (left panel) and T/Li ratio (right panel) d. Statistics, two-way analysis of variance (left panel) or Student’s t-test (right panel); error bars, SEM; ns, not significant; *P < 0.05; ***P < 0.001. Confocal micrographs of tumor sections e. Blue, DAPI; red, CD31, ER-TR7 or α-SMA; green, ZHS-QDs; scale bars, 50 μm; P stands for PanIN. Inset, an area with PanINs
