Fig. 7.

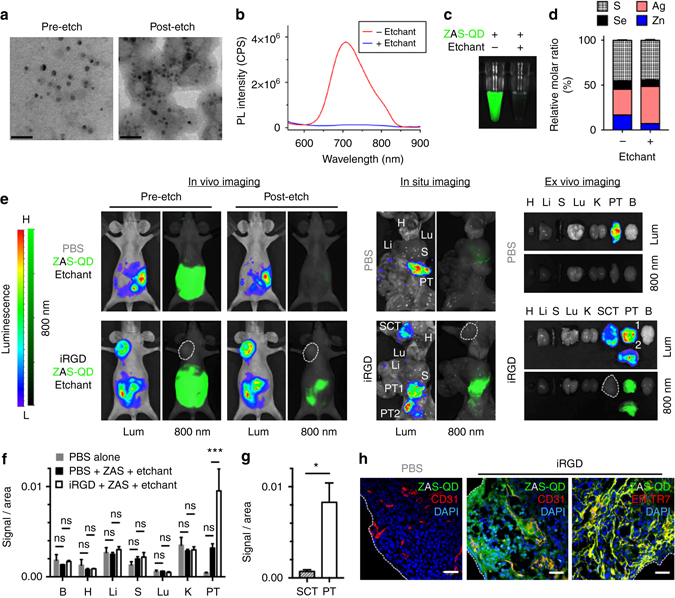
Peritoneal tumor imaging with Hg-free etchable ZAS-QDs. a–c ZAS-QDs characterized by TEM a, PL spectra (excitation: 460 nm) b and NIR imaging with a Li-Cor Pearl imager (green, ZAS-QDs) c before and after Ag-TS treatment. Scale bars, 50 nm. d EDS analysis of ZAS-QDs before and after Ag-TS treatment showed relatively constant S and Se and increased Ag after etching. See Supplemental Table 1 for complete data set. n = 3 per group. e–h Mice bearing peritoneal tumors (PTs) created with MKN45P-luc luciferase-positive human gastric cancer cells received intraperitoneal co-injection of iRGD or PBS with ZAS-QDs followed by Ag-TS. n = 3 per group. In e, live in vivo and post-necropsy in situ images of the tumor mice, and ex vivo images of resected tissues are shown. Lum, luminescence; 800 nm, NIR. The white dotted line marks a subcutaneous tumor (SCT).NIR signal per unit area in collected tissues f and in SCT vs. PT in the iRGD group g. B, brain; H, heart; Li, liver; S, spleen; Lu, lung; K, kidney. Statistics, two-way analysis of variance f or Student’s t-test g; error bars, SEM; ns, not significant; *P < 0.05; ***P < 0.001. Confocal micrographs of PTs h. Blue, DAPI; red, CD31 or ER-TR7; green, ZAS-QDs; scale bars, 50 μm; white dotted lines in h, PT surface
