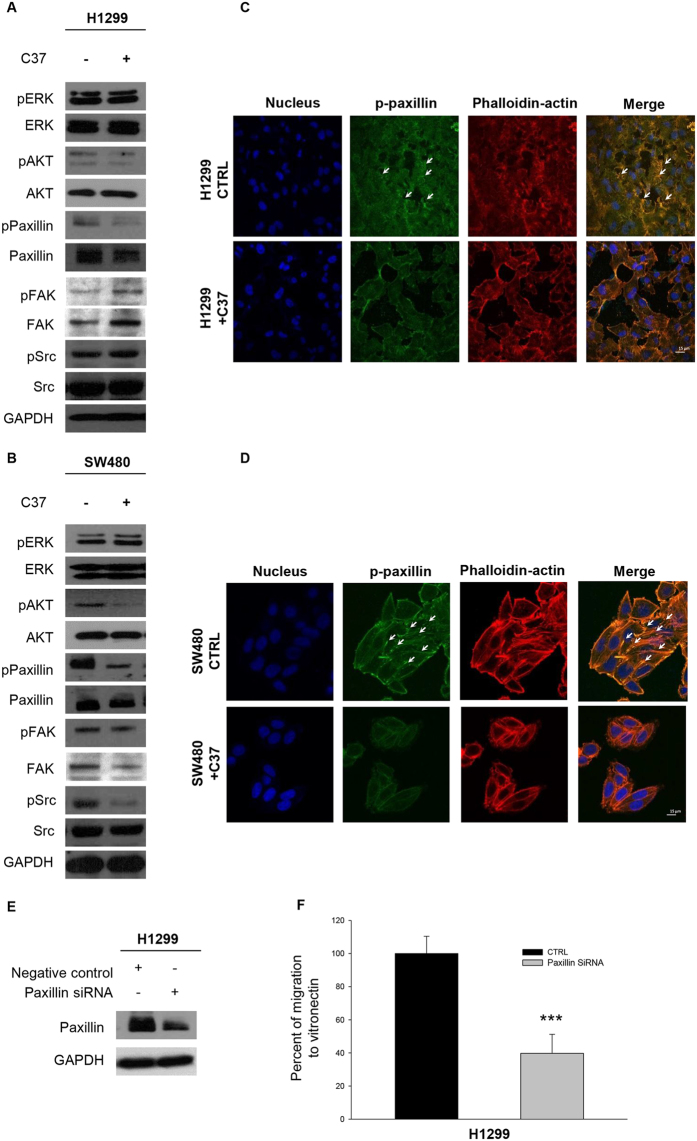
Figure 4.
C37 treatment modulates p-Paxillin in H1299 and SW480 cell lines. (A,B) Immunoblot analysis on total cell lysates from H1299 and SW480 treated with 2,5 μM C37 for 24 hours. All immunoblot bands are cropped, full-length blot images are provided in Supplementary Figure S5. (C,D) H1299 and SW480 cells were plated and treated with 2.5 μM C37 for 24 hours. Monolayers were subjected to immunofluorescent staining of p-paxillin (green), actin (red) and nuclei (blue) and confocal microscopy analysis as described in Methods. Merged column images show overlapping signal. The white arrows indicate cytoskeleton organization. Scale bars, 15 mm. (E) Western blot analysis of H1299 cells 48 h after transfection with paxillin or control siRNA as described in Methods. (F) Percent of cellular migration to VN in H1299cells 48 h after transfection with paxillin or control siRNA as described in Methods.

