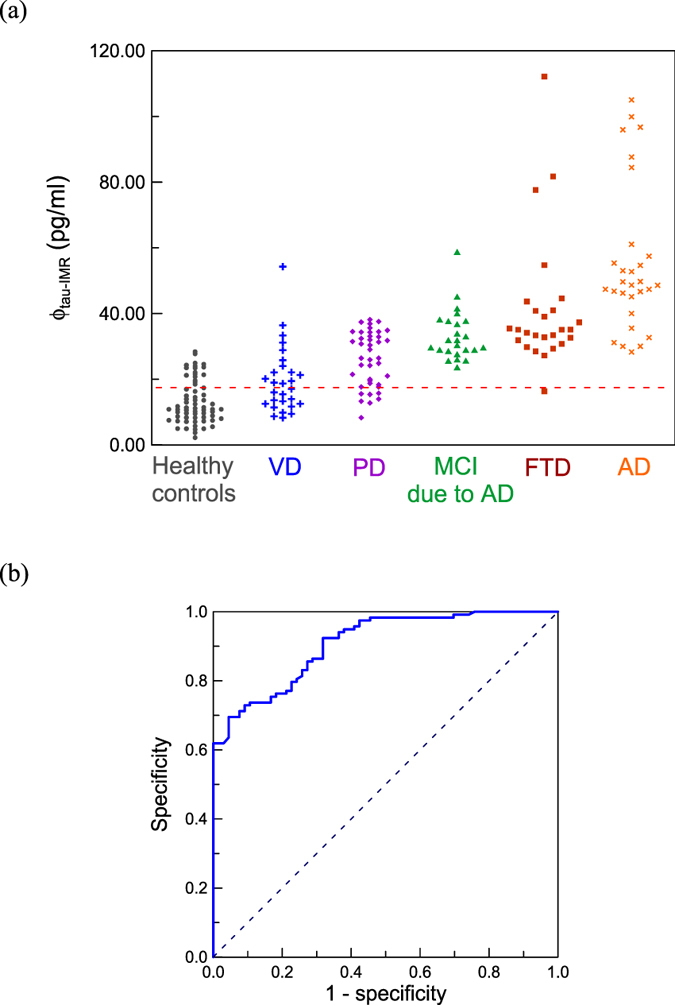
Figure 3.

(a) Measured tau protein concentrations, ϕtau-IMR, in human plasma for healthy controls and various types of dementia, including VD ( ), PD (
 ), MCI due to AD (
 ), FTD (
 ), and AD (
 ). (b) ROC curve for discriminating between healthy controls and dementia subjects in terms of plasma tau protein concentration. The cutoff value of plasma tau protein concentration to discriminate healthy controls from dementia subjects was 17.43 pg/ml, as plotted with the dashed line in (a). The corresponding clinical sensitivity and specificity are 0.856 and 0.742, respectively. The area under the ROC curve is 0.907.
