
Figure 8.
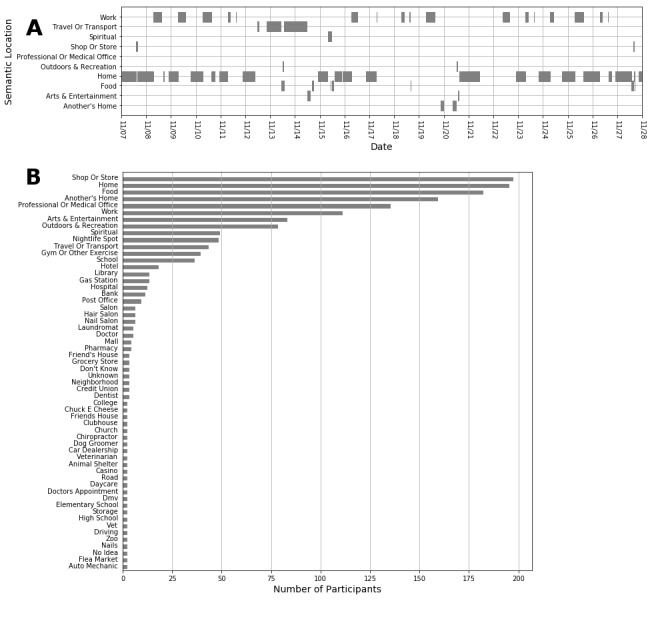
(A) Location report data from one example participant, collected between 11/07/2015 and 11/28/2015. Each rectangle shows the period of time the participant has been in a specific location. The sensor data during that time period is used to create a feature vector, which is then used to detect that semantic location. (B) Top locations visited by all participants, sorted by how many participants visited them. As the total number of unique reported locations was 370, we only included the ones that had been visited by at least two participants.