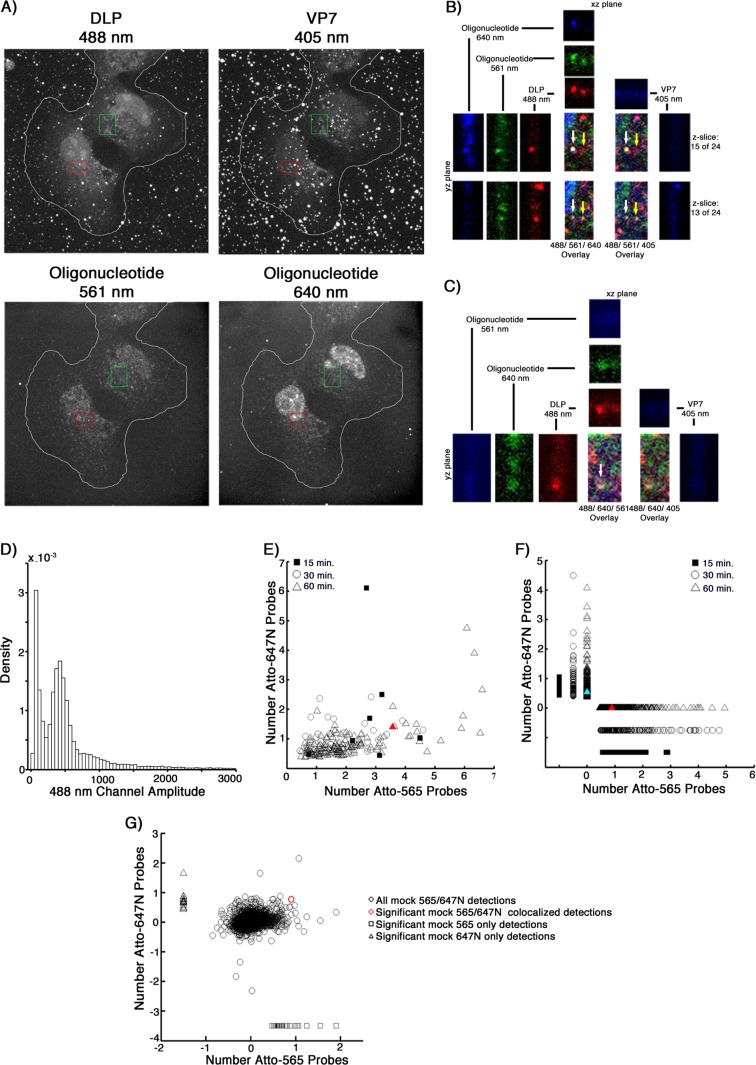
FIG 8.
In situ hybridization with dual-probe oligonucleotides of BSC-1 cells infected at an MOI of 5. (A) Cells were infected at an MOI of 5 for 15, 30, or 60 min with doubly labeled rcTLPs. Paraformaldehyde fixation was followed by overnight incubation with two pools of 22 Atto 565- or Atto 647N-labeled oligonucleotide probes and subsequent 3D imaging at 488-nm (top left), 405-nm (top right), 561-nm (bottom left), and 640-nm (bottom right) excitation wavelengths, maximum-intensity projections of which are shown for a sample after a 60-min incubation. (B) Uncoated DLPs highlighted in the red box in panel A, displaying the individual channels in the xz and yz planes through a DLP colocalized with both probes (white arrow) or with only the Atto 565 probe (yellow arrow), as well as the maximum projection of the overlay of three channels. (C) An uncoated DLP highlighted in the green box in panel A that colocalizes only to the Atto 647N probes (white arrow), displaying the individual channels in the xz and yz planes through the center of the particle, as well as the maximum projection of the overlay of three channels. (D) Probability density of 488-nm channel amplitudes derived from image analysis as described in Materials and Methods. Detections with amplitudes of less than 200 were not considered a DLP, while detections above 750 were considered aggregates or multiple unresolved DLPs. (E) Scatter plot of colocalized Atto 565 and Atto 647N probes derived from DLPs that colocalize with a signal in both channels. The number of each respective probe colocalized with a given uncoated DLP after 15 (■), 30 (○), or 60 (△) min is shown as a scatter plot. The DLP highlighted with the white arrow in panel B is plotted as a red triangle. (F) Scatter plot of colocalized Atto 565 or Atto 647N probes derived from DLPs that colocalize with one or the other probe. The number of respective probes after 15 (■), 30 (○), or 60 (△) min is shown. The DLP highlighted by the yellow arrow in panel B is shown as a red triangle, and the DLP highlighted in panel C is shown as a light blue triangle. (G) In images collected from mock-infected cells probed with combined Atto 565/Atto 647N-labeled oligonucleotide pools, 40 random “DLP” locations were generated, matching the average number of uncoated DLPs calculated from the data in Table 3. Of the 2,400 mock particles (○, black), only 1 (○, red) colocalized with a significant signal in both the 560-nm and the 640-nm channels, 27 (□) colocalized only with a significant 560-nm signal, and 19 (△) colocalized only with a significant 640-nm signal. Quantification of the number of colocalized Atto 565- or Atto 647N-labeled probes was performed as described in Materials and Methods.

