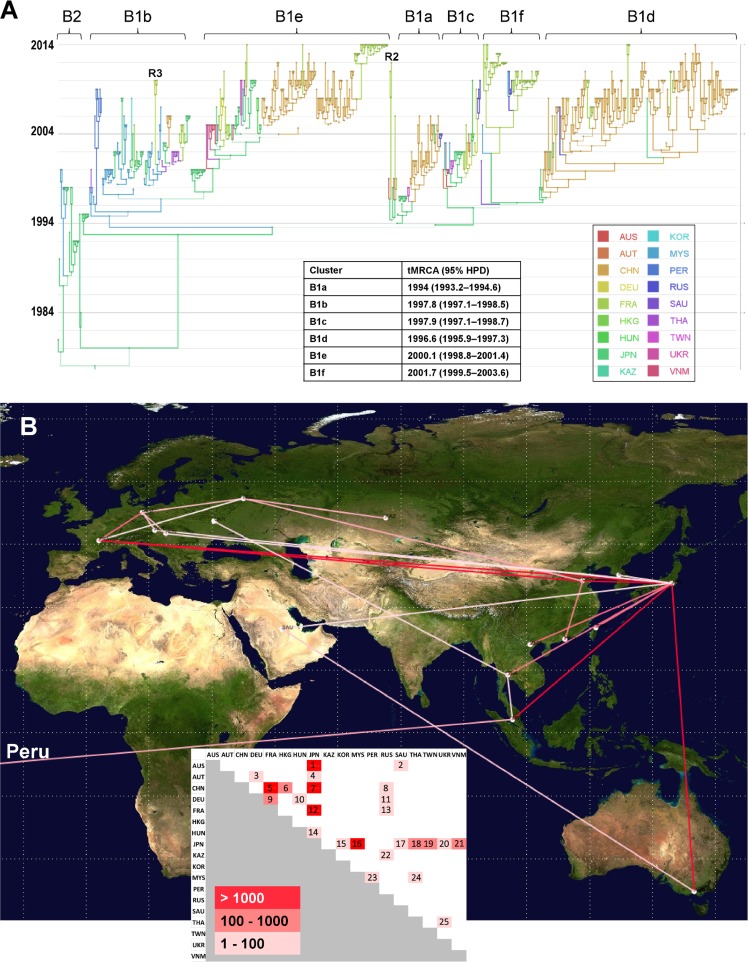
FIG 3.
Phylogeography of coxsackievirus A16 genogroup B. (A) Temporal distribution of lineages. Time is indicated on the left as calendar years in the MCC tree reconstructed with a Bayesian MCMC analysis (discrete phylogeographic model). The branches and tree nodes are colored according to the geographic location that had the highest probability. The size of each circle represents the location's probability. Line width indicates the posterior probability of the corresponding lineage (thick lines indicate high posterior probability values). The time origins (TMRCA) of the main clusters are indicated in the inset table. The tree topology was used to assess the most probable virus migration events between countries shown in panel B. R2, probable intertypic recombinant strain (see Fig. 5A); R3, probable intratypic recombinant strain (see Fig. 5C); AUS, Australia; AUT, Austria; CHN, China; DEU, Germany; FRA, France; HKG, Hong Kong; HUN, Hungary; JPN, Japan; KAZ, Kazakhstan; KOR, South Korea; MYS, Malaysia; PER, Peru; RUS, Russia; SAU, Saudi Arabia; THA, Thailand; TWN, Taiwan; UKR, Ukraine; VNM, Vietnam. (B) Patterns of spatial spread assessed among sampling countries. The sampling countries are indicated with filled white circles. The lines connecting countries are colored according to the heat map (inset) showing Bayes factor (BF) values estimated between two geographic locations. Map source: Google, 2016.

