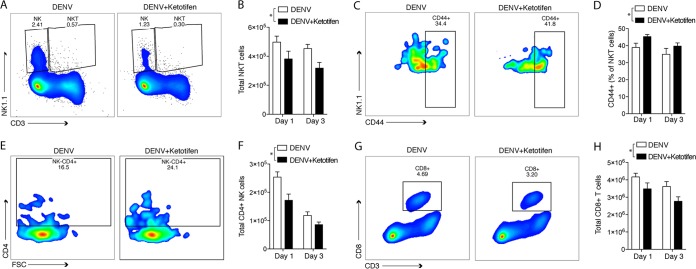
FIG 6.
Flow cytometry validates DCQ predictions. Flow cytometry was performed to validate that DCQ correctly interpreted the frequencies of lymphocytes that were differentially enriched or activated during DENV infection and/or ketotifen treatment. (A) Representative plots from day 3 showing the percentages of NK and NKT cells in the spleen. (B) Quantitation of NKT cells from panel A. (C) Representative plots showing the quantities of CD44+ NKT cells on day 3. (D) Percent expression of CD44 on NKT cells corresponding to data shown in panel C (n = 5). (E) Representative plots showing the percentages of NK cells that are CD4+ on day 1. (F) Quantitation of activated NK cells (NK1.1+ CD4+) on days 1 and 3. (G) Representative plots from day 3 showing the percentages of CD8+ T cells in the spleen. (H) Quantitation of CD8+ T cells from panel G (n = 5). For all panels containing graphs (n = 5), analysis was performed by 2-way analysis of variance (* indicates a P value of <0.05).

