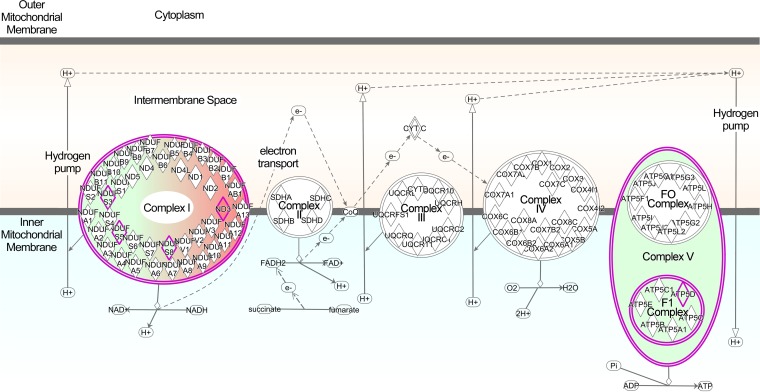
FIG 6.
Ingenuity Pathway Analysis diagram of differentially regulated ETC proteins. Proteins in Tg7Sc mice that were altered in abundance are indicated by diamonds. Green indicates a decrease in the relative abundance of the protein compared to that in Tg7NBH mice, while red indicates an increase in relative abundance. Highly significant differences were observed in components of complex I and ATP synthase (complex V). Abbreviations: NDUS3, NADH dehydrogenase iron-sulfur protein 3; NDUS5, NADH dehydrogenase iron-sulfur protein 5; NDUS8, NADH dehydrogenase iron-sulfur protein 8; ND3, NADH-ubiquinone oxidoreductase chain 3; ATP5D, ATP synthase subunit delta.

