
FIG 5.
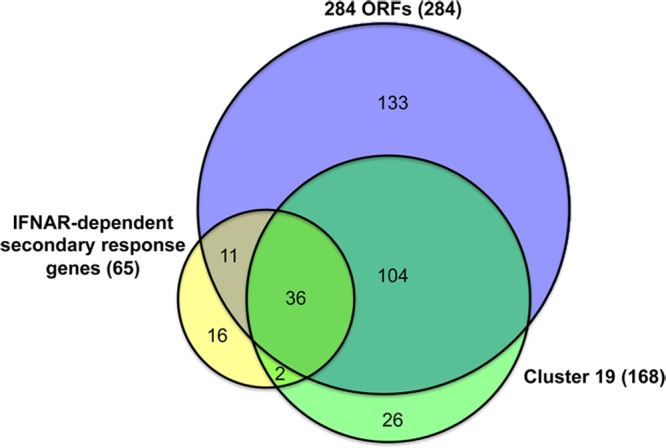
Gene overlap among three different data sets. Colored circles represent different gene lists. Purple, 284 ORFs; green, genes in cluster 19; yellow, the 65 IFNAR-dependent secondary response genes described by Tong et al. (47).
Official websites use .gov
A
.gov website belongs to an official
government organization in the United States.
Secure .gov websites use HTTPS
A lock (
) or https:// means you've safely
connected to the .gov website. Share sensitive
information only on official, secure websites.
Gene overlap among three different data sets. Colored circles represent different gene lists. Purple, 284 ORFs; green, genes in cluster 19; yellow, the 65 IFNAR-dependent secondary response genes described by Tong et al. (47).