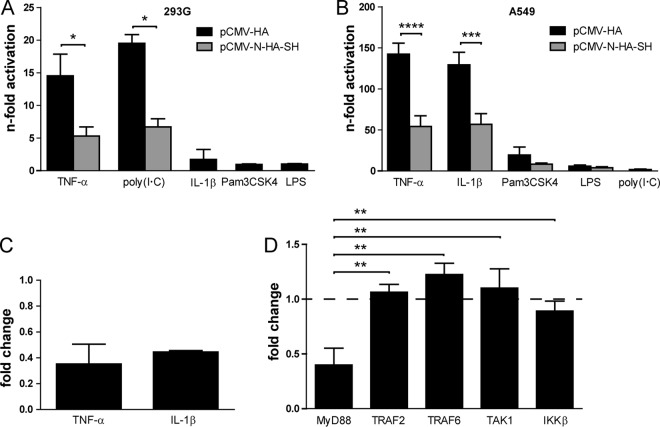
FIG 5.
Effect of SH on NF-κB activation after stimulation with TNF-α, IL-1β, and poly(I·C). 293G (A) and A549 (B) cells were transfected with p(PRDII)5tkΔ(−39)lucter, pCMV-βGal, and pCMV-N-HA-SH or pCMV-HA as a control. At 24 h p.t., cells were stimulated for 4 h with 100 ng/ml TNF-α, 20 μg/ml poly(I·C), 10 ng/ml IL-1β, 5 μg/ml Pam3CSK4, or 1 μg/ml LPS. Afterwards, cells were lysed and analyzed for luciferase and β-galactosidase activity. Graphs depict means ± SD for two (A) or three (B) individual experiments. *, P < 0.05; ***, P < 0.001; ****, P < 0.0001; results were calculated by unpaired t tests with a two-tailed P value. (C) A549 cells were transfected with luciferase and β-galactosidase reporter plasmids. At 24 h p.t., cells were infected with rMuV-SH or rMuV-SHstop at an MOI of 0.5. At 16 h p.i., cells were stimulated for 4 h with 100 ng/ml TNF-α or 10 ng/ml IL-1β. Afterwards, cells were lysed and analyzed for luciferase and β-galactosidase activity. The values for rMuV-SH-infected cells were normalized to those for rMuV-SHstop-infected cells. Graphs depict means ± SD from at least three individual experiments. (D) 293G cells were transfected with luciferase and β-galactosidase reporter plasmids and a plasmid for SH protein expression or the empty vector. In addition, cells were transfected with pUNO.MyD88, pFLAG-CMV2-TRAF2, pME18SFLAG-TRAF6, pCMV-TAK1, or pcDNA3-IKKβ. At 28 h p.t., cells were lysed and analyzed for luciferase and β-galactosidase activity. The values for pCMV-N-HA-SH-transfected cells were normalized to those for pCMV-HA-transfected cells. Graph depicts means ± SD from three individual experiments. **, P < 0.01; results were calculated by unpaired t tests with a two-tailed P value.

