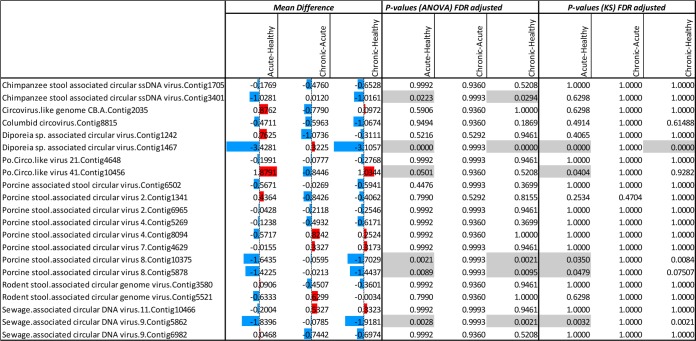
FIG 10.
Statistical comparisons of read number distributions matching different CRESS-DNA viruses of unknown cellular origin generated from healthy animals and those with acute diarrhea or ICD. The numbers reflect the mean difference (the average of the first group minus the average of the second group) in different clinical groups. The colored bars are group mean differences (after log transformation). The red (blue) bars represent higher (lower) read numbers in animals with acute diarrhea or ICD versus healthy animals or in animals with ICD versus animals with acute diarrhea. The ANOVA and KS P values indicate whether the red or blue values are significantly different. P values below 0.05 are shaded.

