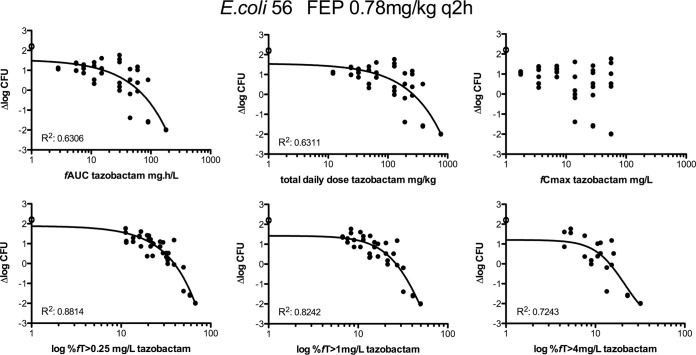
FIG 3.
Dose-response relationships for tazobactam, as determined by dose fractionation experiments, in mice infected in the thighs with E. coli isolate 56. Fixed doses of cefepime were coadministered q2h. The logarithmic scale of the x axis starts at 1. R2 is noted in the left bottom corner of each graph where a curve could be fitted. Open circles represent data for controls without tazobactam.

