
FIG 5.
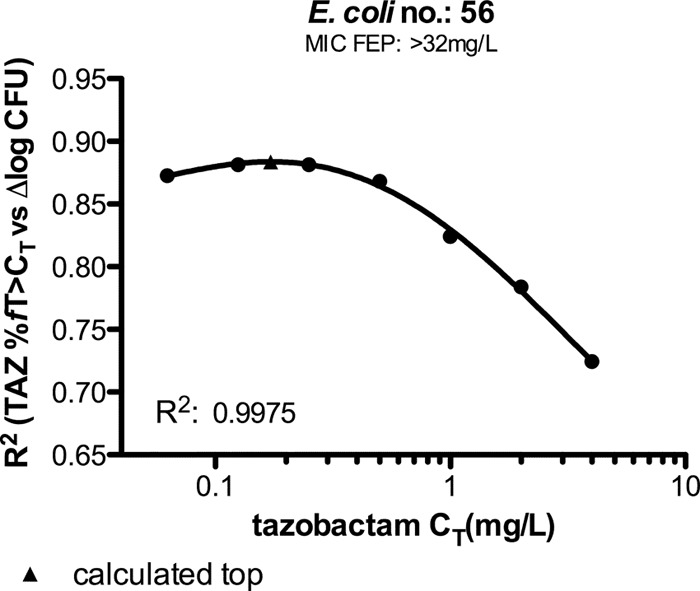
Relationship between R2 of graphs, tazobactam (TAZ) %fT>CT against ∆log CFU, and tazobactam threshold (concentration thresholds of 0.0625, 0.125, 0.25, 0.5, 1, 2, and 4) for E. coli 56. The filled triangle marks the top of the curve.
Official websites use .gov
A
.gov website belongs to an official
government organization in the United States.
Secure .gov websites use HTTPS
A lock (
) or https:// means you've safely
connected to the .gov website. Share sensitive
information only on official, secure websites.
Relationship between R2 of graphs, tazobactam (TAZ) %fT>CT against ∆log CFU, and tazobactam threshold (concentration thresholds of 0.0625, 0.125, 0.25, 0.5, 1, 2, and 4) for E. coli 56. The filled triangle marks the top of the curve.