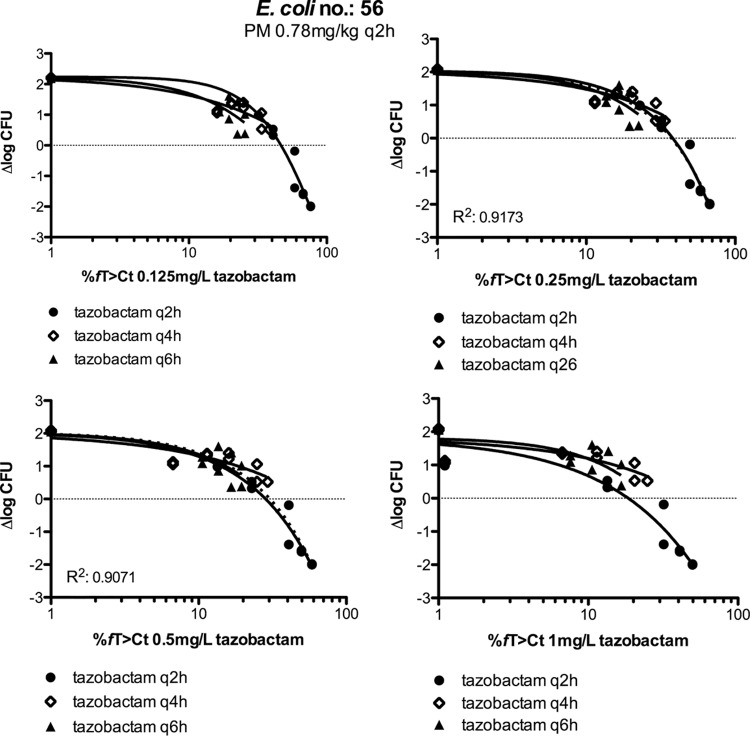
FIG 6.
Relationships of the tazobactam %fT>CT with Δlog CFU for the q2h, q4h, and q6h regimes in experiments using mice whose thighs were infected with E. coli isolate 56. Top and bottom were shared for all data sets (q2h, q4h, and q6h curves) in each graph. Fixed doses of cefepime were coadministered q2h. R2 values pertain to the intersections of the dotted lines with the curves.

