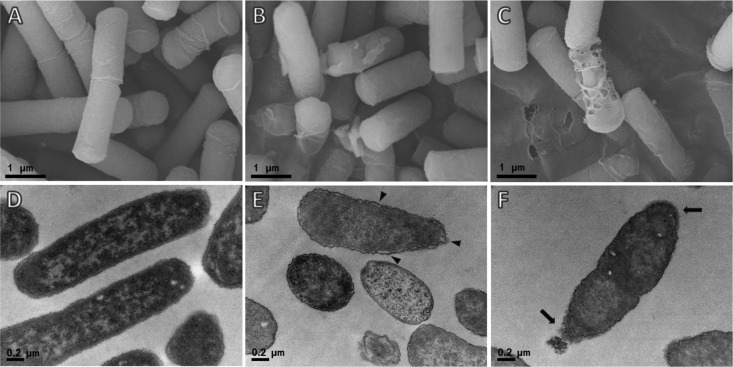
FIG 5.
Electron micrographs showing the effects of ΔPb-CATH4 treatment on E. coli cells. Images were generated using a field emission scanning electron microscope (A, B, C) or using a transmission electron microscope (D, E, F). E. coli cells were incubated with ΔPb-CATH4 (at a final concentration of 2× MIC) for 2 h, and their cell morphology was observed by electron microscopy. (B and C) Ruptured cell walls and pores in the bacterial cell walls. (E and F) Outer membrane detachment (arrowheads) from the cytoplasmic zone and leakage of cytoplasm (arrows) induced by ΔPb-CATH4. (A and D) Untreated negative controls.

