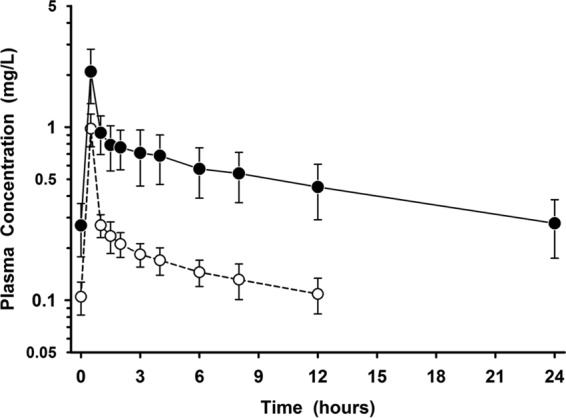
FIG 1.

Mean ± SD plasma concentration-versus-time profiles before and after the final intravenous dose of omadacycline at 100 mg once daily (filled circles) and tigecycline at 50 mg every 12 h (open circles). The data on the y axis are on the log scale.
