FIG 2.
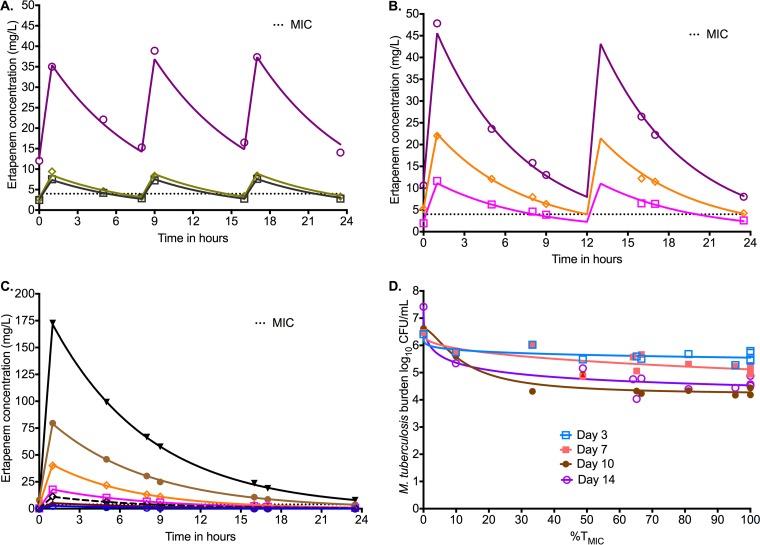
Dose fractionation study to determine PK/PD index linked to ertapenem efficacy. The concentration time profiles are shown relative to the MIC. Symbols indicate measured concentrations and the lines modeled profile. (A) Concentration-time profiles of ertapenem identified in the HFS-TB with a dosing schedule of every 8 h. (B) Concentration-time profiles of ertapenem identified in the HFS-TB with a dosing schedule of every 12 h. (C) Concentration-time profiles of ertapenem identified in the HFS-TB with a dosing schedule of once a day. Given the concentration range, the scale obscures the time that concentrations persisted above MIC for some doses. For the blue open circles, the lowest concentration, the time above MIC was 0 h. For the dose shown by cayenne triangles the time was 3 h, for the black open diamonds it was 8.32 h, and for the open magenta squares it was 11.7 h. The rest can be read off the graph. (D) Inhibitory sigmoid Emax model for %TMIC versus bacterial burden. On day 7, the maximal kill (Emax) was 1.14 log10 CFU/ml, consistent with findings in the first HFS-TB dose-effect study. The study was carried out for only 14 days. Examination of the curves on each day shows that 80% of maximal kill occurs around a %TMIC of 40% on all sampling days except day 3, when it occurs with lower exposures.

