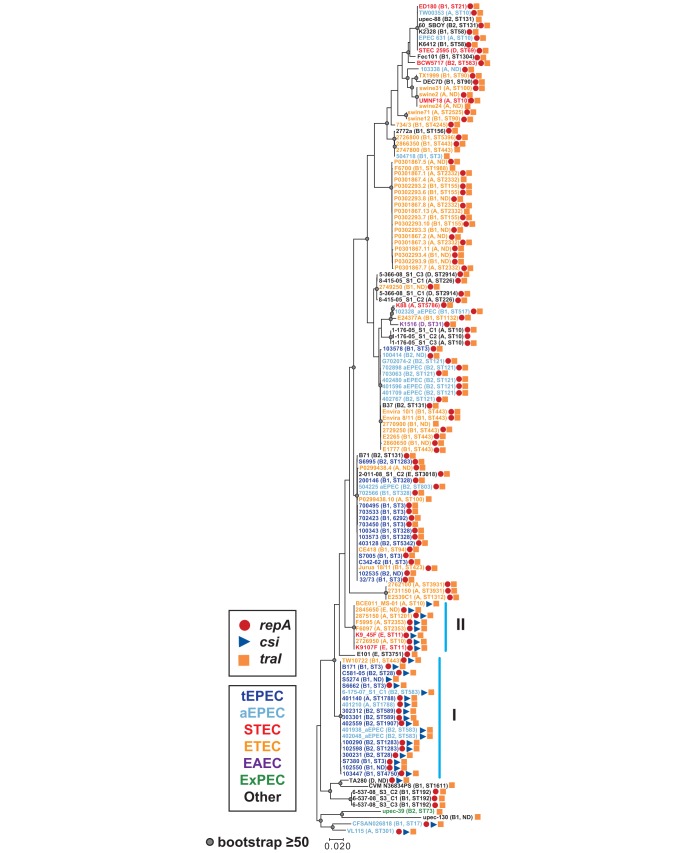
FIG 5.
Phylogenetic analysis of traI. The traI nucleotide sequences of pB171_90 and other E. coli strains were aligned using ClustalW. The alignment was used to construct a maximum-likelihood phylogeny with the Kimura 2-parameter model and 1,000 bootstraps using MEGA7 (79). The scale bar represents the approximate distance of 0.02 nucleotide substitutions per site. Bootstrap values of ≥50 are indicated by a gray circle. The predicted E. coli pathotypes are indicated by the color of their genome label (see legend), and the phylogroup and MLST of each genome is denoted in parentheses. The blue vertical lines indicate the two clades identified in the csi phylogeny (Fig. 4).

