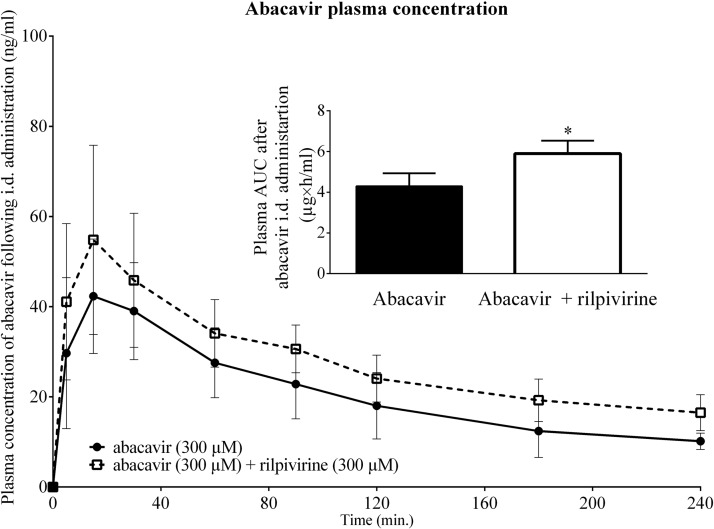
FIG 5.
Influence of rilpivirine (300 μM) on plasma concentration of abacavir (300 μM) after i.d. administration. Data are shown as means ± SD (n = 6). Statistical significance was analyzed by unpaired t test. *, P ≤ 0.05. The rilpivirine AUC0–240 min was calculated using the trapezoid rule, where the formula ΔX × (Y1 + Y2)/2 was used repeatedly by GraphPad Prism 6.0 software (GraphPad Software, Inc., San Diego, CA, USA).

