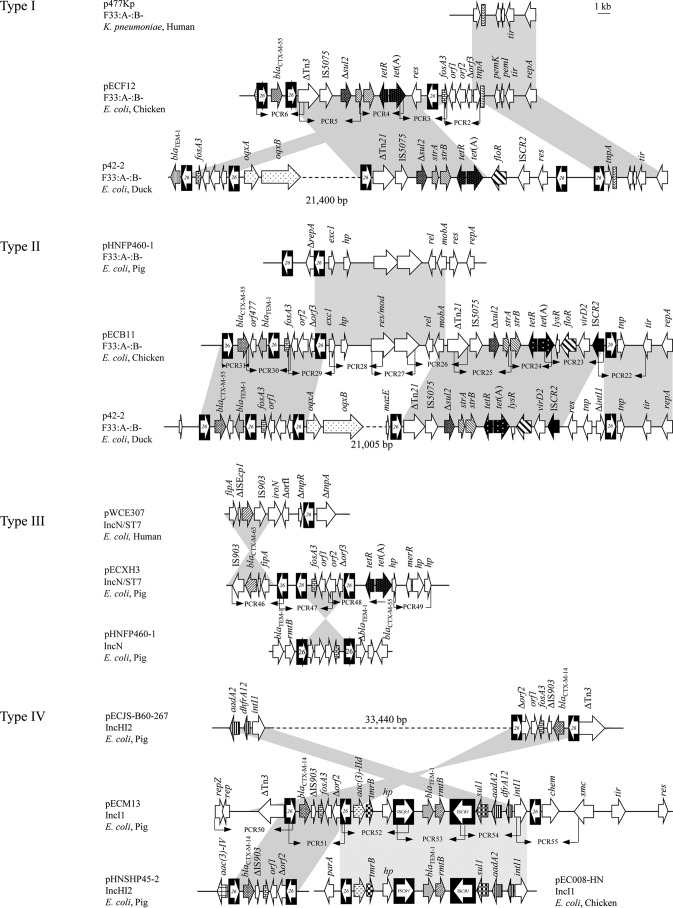
FIG 1.
Schematic presentation and comparison of the genetic environment of fosA3 in four plasmids with other related plasmids. The arrows indicate the positions and directions of transcription of the genes. Gray shading indicates >99% nucleotide sequence identity. PCR2-PCR6, PCR22-PCR31, PCR46-PCR49, and PCR50-PCR55 used to investigate the type I, II, III, and IV structures of the fosA3 environment are indicated by black arrowheads. Δ indicates a truncated gene. A 1-kb distance scale is displayed in the upper right corner. Diagrams were drawn from sequences deposited in the GenBank database under accession numbers LN897475 (p477kp), KT990220 (p42-2), KJ020575 (pHNFP460-1), HM440049 (pWCE307), KX254341 (pECJS-B60-267), KU341381 (pHNSHP45-2), and KP010147 (pEC008-HN).

