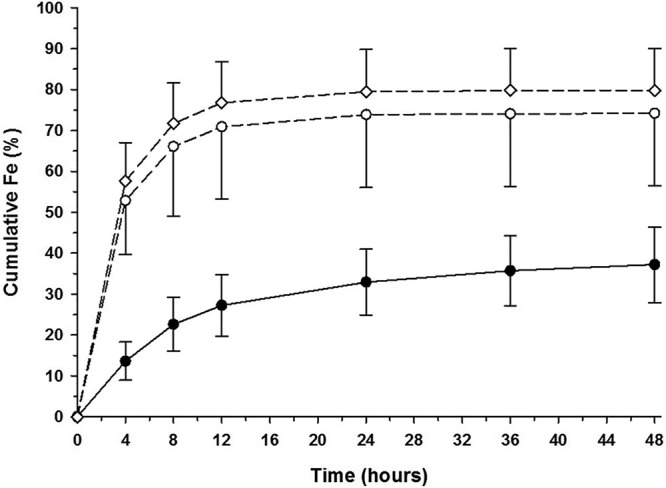
FIG 2.

Mean (±SD) cumulative fraction (percent) of the fosfomycin dose excreted in urine over time following oral and intravenous administration. Intravenous administration of 1 g is illustrated by open circles and a dashed lined, and 8 g is illustrated by open diamonds and a dashed line. Oral administration is illustrated by filled circles and a solid line.
