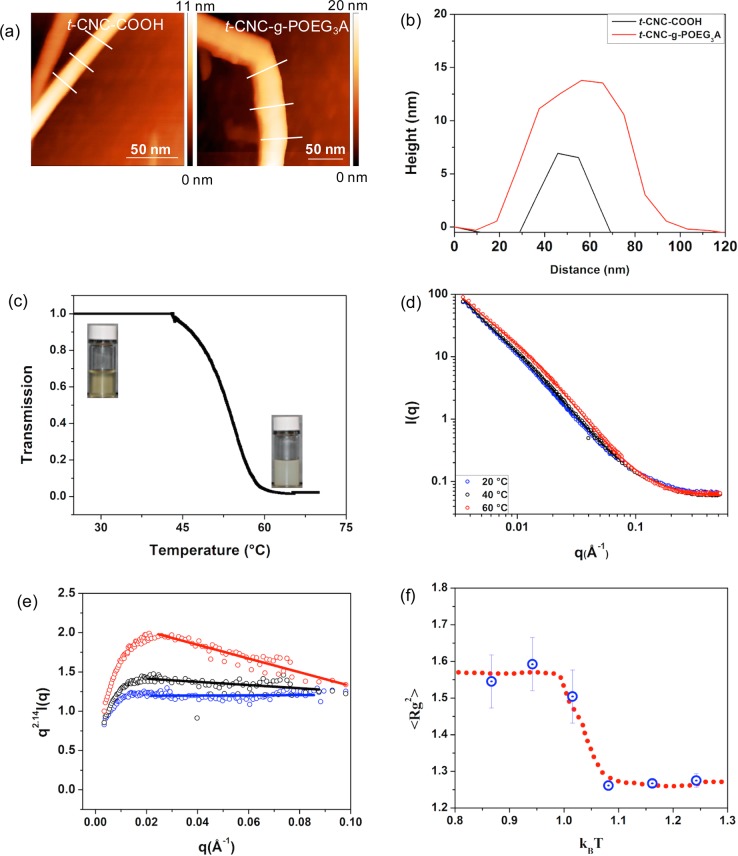
Figure 2.
Characterization of t-CNC-g-POEG3A. (a) AFM height images (line in AFM height images corresponds to cross sections used to calculate the area and height of the t-CNCs). (b) Averaged height profiles of t-CNC–COOH and t-CNC-g-POEG3A. (c) Cloud point test as a function of temperature showing the LCST behavior of an aqueous dispersion of t-CNC-POEG3A. (d) Small angle neutron scattering profile of t-CNC-g-POEG3A as a function of temperature. (e) Kratky plot showing the difference in the slope of the scattering profile at different temperatures (linear fit is inserted to help guide the eye). (f) Simulation of the mean square radius of gyration of grafted polymer on nanorods with respect to temperature (kBT set at 1 for LCST); blue dots are the simulated radius of gyration, red dotted line is a guide for the reader’s eye, and errors bars represent the standard deviations of the simulated data.

