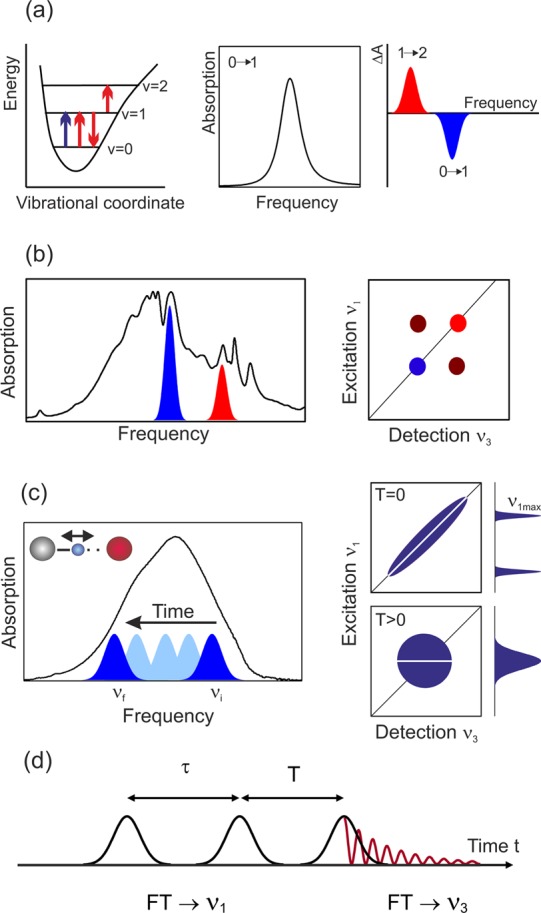
Figure 5.

(a) Pump–probe spectroscopy. Excitation by an ultrashort pump pulse (blue arrow, left) results in a transient change of the linear absorption spectrum (middle), which is measured by the probe pulse (red arrows, left). An absorption decrease ΔA < 0 occurs on the v = 0 → 1 transition, while the v = 1 → 2 absorption is enhanced (right panel). (b) (Left) Linear infrared absorption with contributions from different vibrational transitions. (Right) Nonlinear 2D infrared spectrum consisting of peaks on the diagonal ν1 = ν3 (colored) and off-diagonal (cross) peaks (black). The strength of cross peaks reflects the vibrational coupling strength. (c) (Left) Spectral diffusion from an initial frequency νi to a frequency νf within an inhomogeneously broadened vibrational band. In the 2D spectrum, this process leads to a change from an elliptic to a round line shape with increasing waiting time T. This loss of frequency correlation can be quantified with the help of so-called center lines (CLs, white) which connect the maximum signals at different detection frequencies ν3. The decrease of the CL slope as a function of T is a measure for the correlation decay. (d) Pulse sequence in 3-pulse photon echo experiments with the coherence time τ, the waiting time T, and the real time t.
