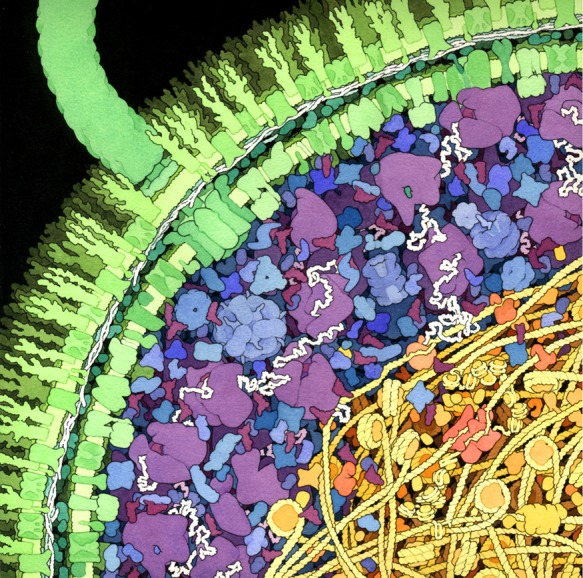
Figure 8.

Schematic representation of part of an E. coli cell, including cell wall (green), cytoplasm area (blue and purple), and nucleoid region (yellow and orange). Water molecules are not shown (Illustration by David S. Goodsell, the Scripps Research Institute219).
