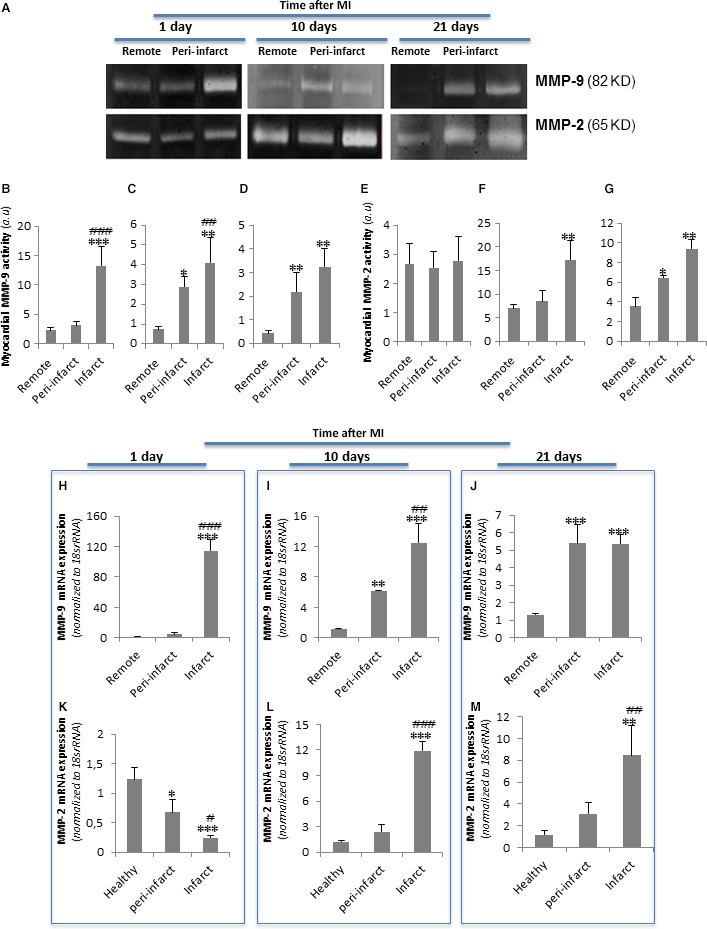
Figure 4.

Temporal and spatial evolution of myocardial MMP‐9 and MMP‐2 activation and expression after MI. (A) Representative zymography analysis results showing myocardial MMP‐9 and MMP‐2 activity. Bar graphs showing the mean ± S.D. of MMP‐9 and MMP‐2 activity in the remote, peri‐infarct and infarct zones at 1 (B and E), 10 (C and F) and 21 (D and G) days after MI. (H–M) Real‐time PCR showing MMP‐9 and MMP‐2 mRNA expression levels. Data were processed using a specially designed software program based on the Ct values of each sample and normalized to 18s rRNA, which served as an endogenous control. The results are shown as the mean ± S.D. of MMP‐9 and MMP‐2 mRNA expression levels in the remote, peri‐infarct and infarct zones at 1 (H and K), 10 (I and L) and 21 (J and M) days after MI. n = 8. *P < 0.05 versus remote; **P < 0.01 versus remote; ## P < 0.01 versus peri‐infarct; ***P < 0.005 versus remote; ### P < 0.005 versus peri‐infarct.
