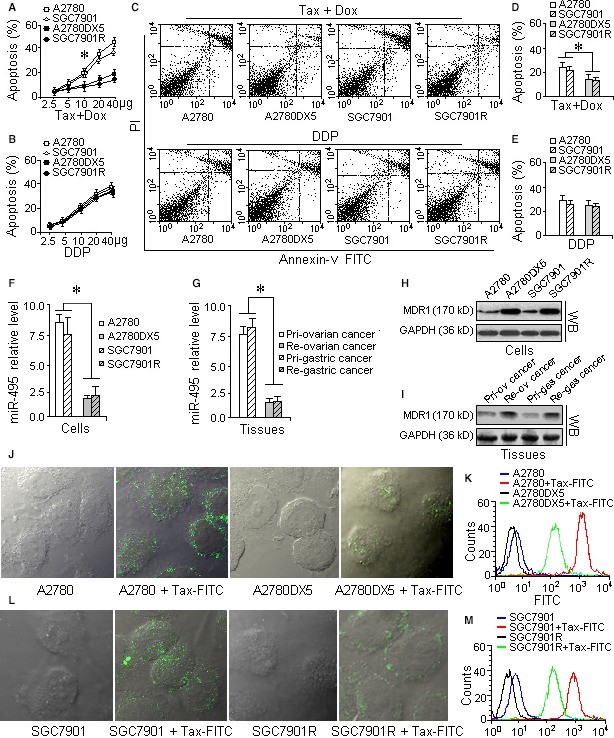
Figure 1.

A2780DX5 and SGC7901R cells are more resistant to the combination of taxol and doxorubicin and express more MDR1 than the sensitive cell lines A2780 and SGC7901. To determine which cells were more resistant to the drug mixture, four cell lines were treated with gradually increasing doses. The cell line with the least apoptosis, as assayed by flow cytometry, could survive at a higher dose of the drug mixture and can be regarded resistant cells. If the MDR was caused by the expression of MDR1, the MDR cells might express more MDR1, so we assayed the protein and mRNA levels of MDR1 by Western blot and rt‐QPCR analysis, respectively. As an indicator for drug accumulation, we treated the cells with FITC‐labelled taxol to demonstrate that the cells with the highest expression of MDR1 also pumped out more of the chemotherapeutic drug, resulting in lower drug accumulation and causing MDR. (A) Dose‐dependent apoptosis of the MDR cell lines A2780DX5 and SGC7901R and drug‐sensitive cell lines A2780 and SGC7901 treated with the taxol‐doxorubicin combination. A2780DX5 and SGC7901R cells can resist higher concentrations of the drug combination than the A2780 and SGC7901 cells. (B) Dose‐dependent apoptosis of the MDR cell lines A2780DX5 and SGC7901R and the sensitive cell lines A2780 and SGC7901 treated with cisplatin. Cisplatin is not the substrate of MDR1; hence, the apoptosis of the four cell lines did not significantly differ. (C) Treatment with a 10 μg/ml dose of the taxol‐doxorubicin mixture for 15 hrs resulted in approximately 22% apoptosis in the sensitive cell lines A2780 and SGC7901 but only caused a 13% cell death rate in the MDR cell lines A2780DX5 and SGC7901R. However, 20 μg/ml of cisplatin only resulted in a 28% apoptosis rate, with no significant differences among the four tested cell lines. (D) The quantification of the apoptosis caused by the taxol‐doxorubicin combination in the four tested cell lines. The A2780DX5 and SGC7901R cells could resist a higher dose of the drugs than the A2780 and SGC7901 cells. (E) The quantification of the apoptosis caused by cisplatin alone in the four tested cells lines, A2780, SGC7901, A2780DX5 and SGC7901R. (F) The MDR cell lines A2780DX5 and SGC7901 expressed less miR‐495 than the sensitive cell lines. (G) Recurrent ovarian and gastric tumours expressed less miR‐495 than the primordial tumours of cancer patients. (H) The MDR1 levels in the MDR cells A2780DX5 and SGC7901R are higher than those in the sensitive cells A2780DX5 and SGC7901. (I) The MDR1 levels in the recurrent ovarian and gastric tumours are higher than those in the corresponding primordial tumours. (J and L) The FITC‐labelled anticancer drug taxol (bright green spots) accumulated less in the A2780DX5 and SGC7901R cells. (K and M) The drug fluorescence (the green histogram) is weaker compared with the drug‐sensitive A2780 cells (the red curve), indicating that more FITC‐taxol may have been pumped out of the cells. *Student's t‐test (paired, one tailed), P < 0.05, n = 5. The following conditions are the same.
