Figure 3.

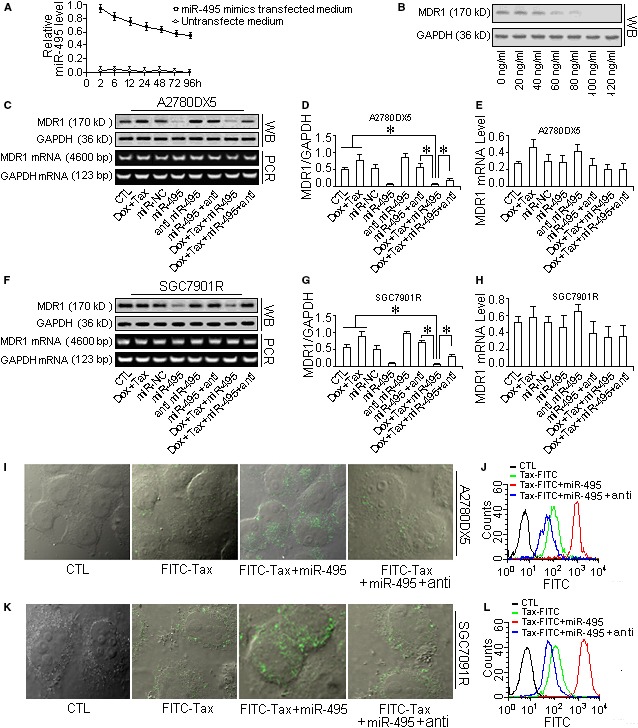
miR‐495 mimic injections down‐regulated MDR1 and reduced the efflux of taxol from the cells. To verify the role of MDR1 in drug efflux, the miR‐495 mimic was overexpressed in MDR cells by transfection, and then, the MDR1 inhibition was verified with by Western blot analysis, and the drug accumulation was measured using the indicator FITC‐labelled taxol. (A) Half‐life assay of the miR‐495 mimic in the cell culture medium. (B) Dose‐dependent effect of the miR‐495 mimic on the suppression of MDR1 expression in A2780DX5 cells. The MDR1 protein level decreased with the transfection of increased amounts of the miR495 mimic. (C) The protein and mRNA levels of MDR1 in differently treated A2780DX5 cells. (D) The quantification of the MDR1 protein in cells. (E) The quantification of the MDR1 mRNA in cells. (F) The protein and mRNA levels of MDR1 in differently treated SGC7901R cells. (G) The quantification of the MDR1 protein in differently treated SGC7901R cells. (H) The quantification of the MDR1 mRNA in differently treated cells. Transfecting miR‐495 into the two MDR1‐rich cell lines only reduced the MDR1 protein expression, whereas it did not affect the mRNA expression. (I and K) Using the FITC‐labelled taxol as an indicator to measure the ability of cells to absorb the drug, we demonstrated that the MDR1 reduction caused a decrease in drug efflux, and more FITC‐taxol accumulated in the A2780DX5 and SGC7901R MDR cancer cells. (J and L) miR‐495 administration strengthened the fluorescence (which was emitted by FITC‐taxol in the cells (the red histogram). The miR‐495 antisense RNA abolished the drug accumulation, and fewer drug molecules were retained in the cells, resulting in weakened fluorescence (blue histogram). *Student's t‐test (paired, one tailed), P < 0.05, n = 5.
