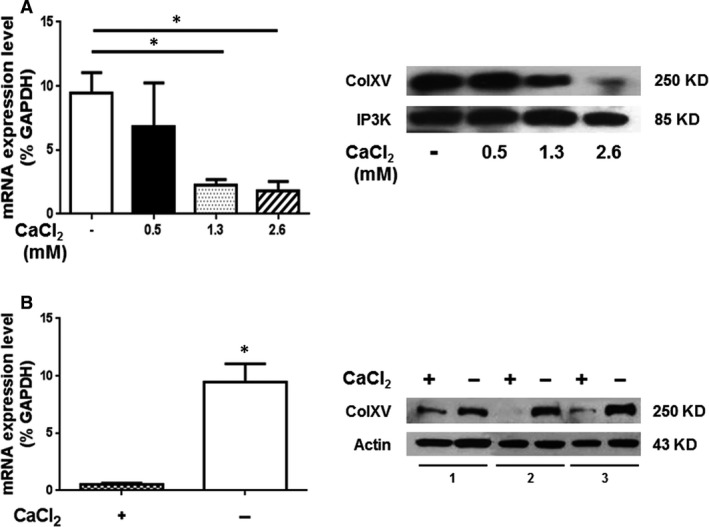
Figure 4.

ColXV expression in osteoblasts. The analysis was performed by qRT‐PCR and Western blot in hOBs isolated and exposed to increasing concentrations of extracellular CaCl2 (0.5, 1.3 and 2.6 mM) for 48 hrs (A) or chronically maintained in calcium‐containing (1.3 mM) (+) or calcium‐free (−) medium for 7 days (B). Statistical analysis was performed in calcium‐free versus calcium‐containing medium condition. *P ≤ 0.05 was considered statistically significant.
