Figure 1.

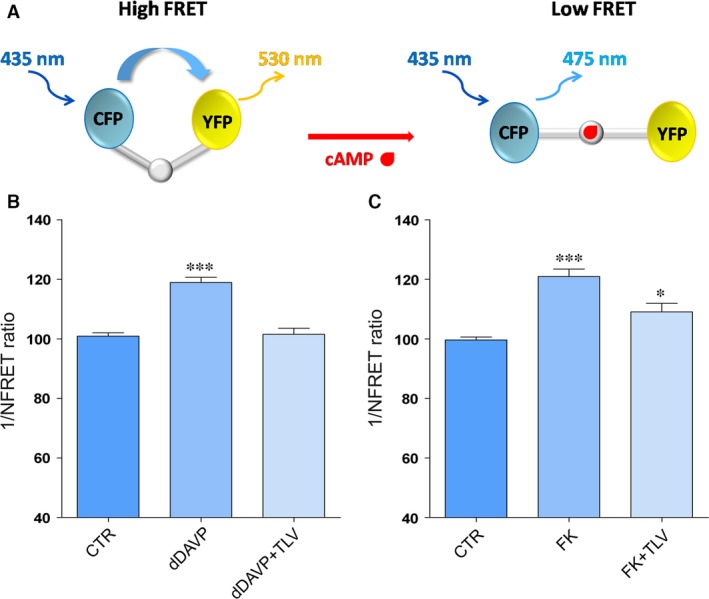
Evaluation of cAMP levels by fluorescence resonance energy transfer (FRET) analysis. (A) Schematic model showing a FRET probe containing cAMP‐binding sequence of Epac1 sandwiched between ECFP (donor) and EYFP (acceptor). Binding of cAMP to the Epac1 results in an intermolecular steric conformation causing an increase in the distance between the fluorescent donor and the acceptor, decreasing FRET process. (B) Histogram (means ± S.E.Ms; ***P < 0.0001) compares changes in normalized FRET reciprocal ratio (1/NFRET) with the cytosolic EPAC‐based cAMP FRET sensor (H96) under basal (CTR, n = 120 cells), dDAVP (n = 84 cells) and dDAVP with tolvaptan (dDAVP+TLV, n = 96 cells) treatments. (C) Histogram (means ± S.E.Ms; ***P < 0.0001 versus CTR; *P < 0.01 versus CTR) compares changes in normalized FRET reciprocal ratio (1/NFRET) with the membrane target EPAC‐based cAMP FRET sensor (H30mp) under basal (CTR, n = 30 cells), forskolin (FK, n = 37 cells) and forskolin with tolvaptan (FK+TLV, n = 30 cells) treatments.
