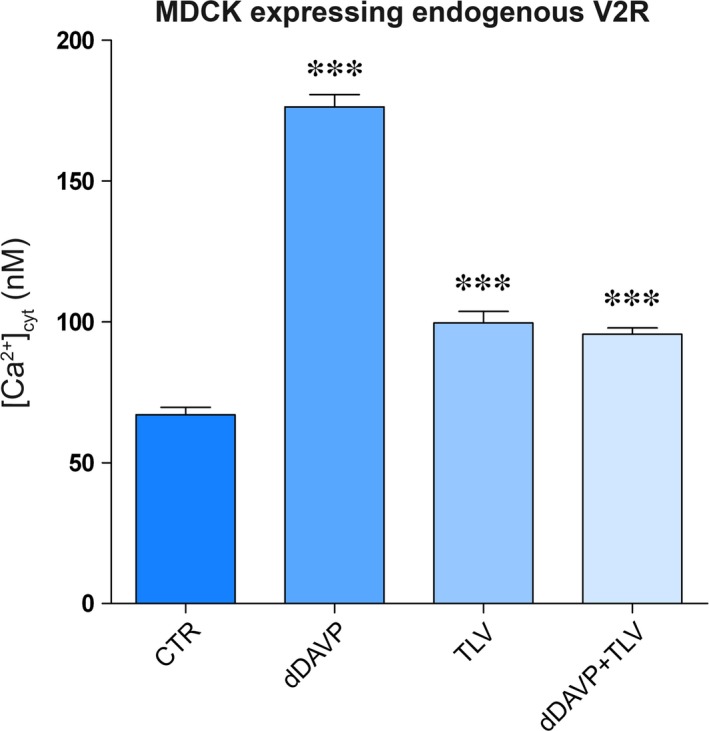
Figure 4.

Evaluation of intracellular calcium content. MDCK‐hAQP2 cells were loaded with 7 μM fura‐2‐AM for 15 min. at 37°C in DMEM. Fluorescence measurements were taken with Metafluor software (Molecular Devices, MDS Analytical Technologies). Free cytosolic [Ca2+] was calculated according to Grynkiewicz formula as described in concise methods and measured in cells left under basal conditions (CTRL, n = 116 cells), or treated with dDAVP (n = 47 cells), TLV (n = 127 cells), or dDAVP in the presence of TLV (n = 44 cells). Data are expressed as means ± S.E.Ms (***P < 0.0001 versus CTR).
