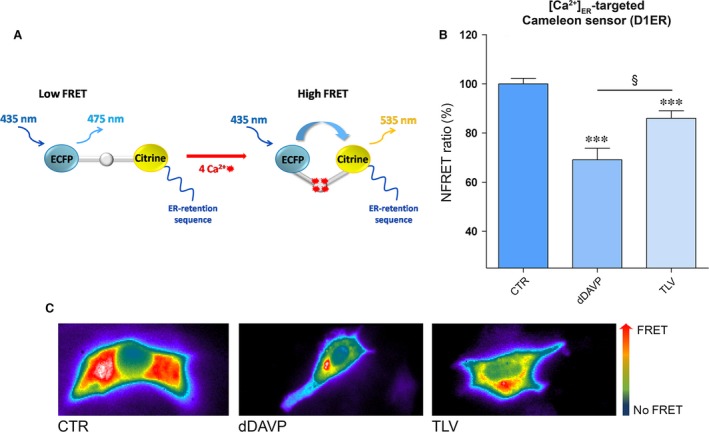
Figure 7.

Evaluation of [Ca2+]ER with ER‐targeted Cameleon (D1ER) probe. (A) Model showing the Cameleon (D1ER) probe. Binding of calcium to calmodulin sequence results in an intramolecular rearrangement of the probe leading to an increase in NFRET signal. (B) Histogram (means ± S.E.Ms; ***P < 0.0001 versus CTR; §P < 0.0001 dDAVP versus TLV) compares changes in normalized FRET (NFRET) ratio between control (n = 52 cells), dDAVP (n = 50 cells)‐ and tolvaptan (n = 49 cells)‐treated cells. (C) Representative transfected cells with the ER‐targeted cameleon showing the FRET signal (ratio of 535/480 nm) which is depicted in false colors.
