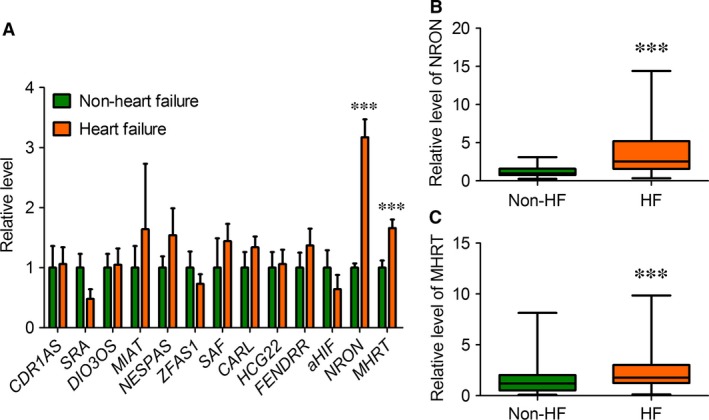
Figure 1.

Changes in circulating lncRNA levels in patients with HF relative to non‐HF control participants. (A) Circulating levels of lncRNAs were determined by quantitative real‐time RT‐PCR (qPCR) with the plasma samples prepared from HF patients and non‐HF control participants. Note that only NRON and MHRT demonstrated significant differences between patients HF and non‐HF control participants. Data are presented as mean ± S.E.M. ***P < 0.0001, n = 72 for HF and n = 60 for non‐HF control participants. (B & C) Box plot of plasma NRON and MHRT levels, respectively, providing a non‐parametric illustration of numerical data displaying the degree of dispersion (spread), skewness in the data (asymmetry of distribution) and outliers, without making any assumptions of the underlying statistical distribution. ***P < 0.0001, n = 72 for HF and n = 60 for non‐HF control participants.
