
Figure 4.
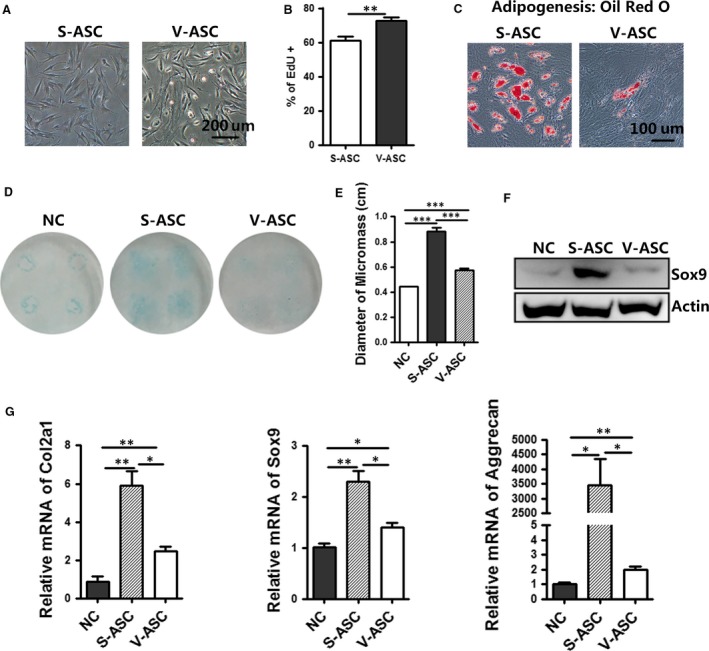
Chondrogenic gene expression and cartilage phenotype differentiation of human S‐ASCs and V‐ASCs in vitro.(A) Morphology of cultured human abdominal S‐ASCs and V‐ASCs in passage P2. Scale bar = 200 μm; (B) primary ASCs were incubated with EdU (10 μM) for 24 hrs and EdU+ cells were analysed by flow cytometry; (C) Oil Red O staining of adipocytes differentiated from S‐ASCs and V‐ASCs on day 8. Scale bar = 100 μm (D–G). The chondrogenesis capabilities of human S‐ASCs and V‐ASCs were evaluated by Alcian blue staining (D), diameter of the micromass (e) (n = 4), Western blot analysis of lysates (40 μg) (F) and relative mRNA expression of the indicated chondrocyte‐related markers (G)(n = 3) with non‐differentiated or differentiated medium on day 21. *P < 0.05, **P < 0.01, ***P < 0.001.