Figure 3.

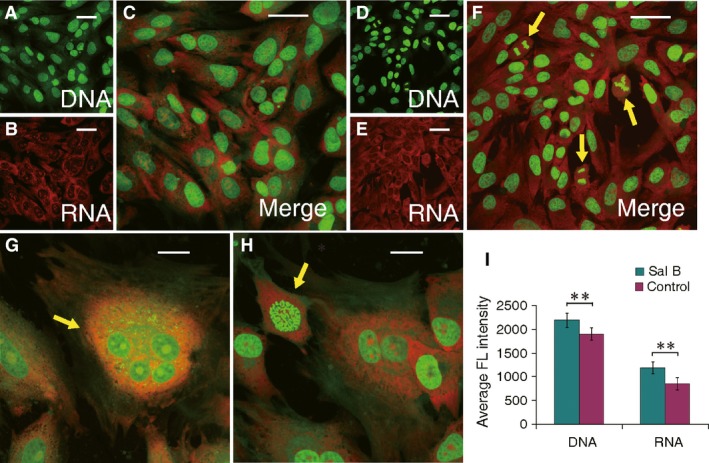
Morphological changes of Sal B‐treated chondrocytes analysed by acridine orange staining and CLSM. The specific intercalary labelled DNA and electrostatic attractively labelled RNA in cells (cationic) excite and emit at different wavelength to be captured as fluorescent green and red, respectively. The labelled nucleic acids display the contour of cells, and their relative intensity implicates DNA duplication and RNA synthesis. (A–C) The acquired images of chondrocytes with stained DNA (A) and RNA (B) merged into dual‐channel image (C) in untreated cells. (D–H) The acquired images of chondrocytes with labelled DNA (D) and RNA (E) images then merged to a dual‐channel image (F) for Sal B‐treated cells. Higher level of DNA and RNA staining is apparent in Sal B‐treated chondrocytes (F) than those in control cells (C), which reflect the promoted genetic processing and gene transcription and were further showed in various subcellular formats (indicated by arrows) in the cycling cells (F–H). (I) Significant higher levels of DNA and RNA in Sal B‐treated chondrocytes (green) than those in control cells (purple) were quantitatively revealed by intensity analysis of the dual fluorescent labelling. Scaled bar (﹣) represents 50 μm. **P < 0.01.
