Figure 4.

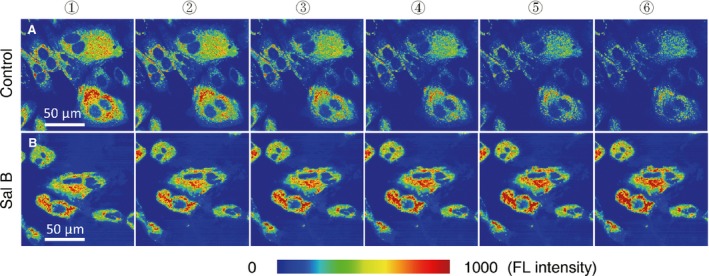
Retention of stimulated mitochondrial membrane potential in alive chondrocytes treated by Sal B. Series of images from the region of interest (ROI) were acquired by CLSM for 25 min. after the cells were stained with HR 123, which specifically labels mitochondria with fluorescence colours presented as fluorescence intensity of blue (weak) gradually to red (strong). (A) Control cells: the labelled mitochondria in ROIs before the Sal B treatment presented as the baseline (A①), then images acquired and selected by 5 min. intervals (A②–⑥). The fluorescence labels for active mitochondria faded away as the time lapses. (B) Sal B‐treated cells: the labelled mitochondria in ROIs before Sal B stimulation set as the baseline (B①), followed by images acquired and presented as in (A) (B②–⑥). The stimulated mitochondrial membrane potential in the treated chondrocytes holds during the experiment with a trend of increasing.
