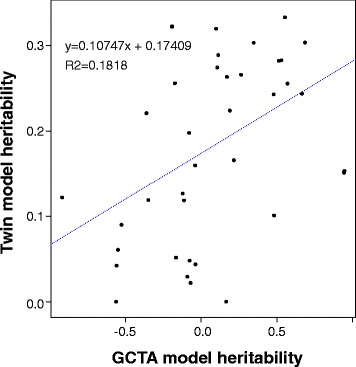
Fig. 3.

Heritabiltiy estimate comparison: Twin model heritability estimates vs amount of variate accounted for by common single nucleotide (“heritability”) via GCTA for the Euoropean population (n = 818) for traits continuous in both samples (n = 40). The correlation between the estimates is significant with a P value of 0.00609
