
Fig. 2.
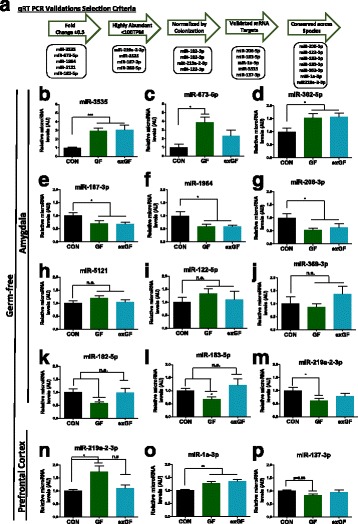
qRT-PCR validations of miRNA seq data within the amygdala and PFC of male GF mice. a Criteria for miRNA selection for validation via qRT-PCR. b–m qRT-PCR of miRNAs reported to be dysregulated in the amygdala of GF mice. n–p qRT-PCR validations of reported altered microRNA in the PFC. Bar graphs represent average values in 12 mice per group after U6 normalization relative to average control levels. Fold changes is in comparison with CON group. Data graphed as ± SEM (P < 0.05*; P < 0.01**; P < 0.001***)