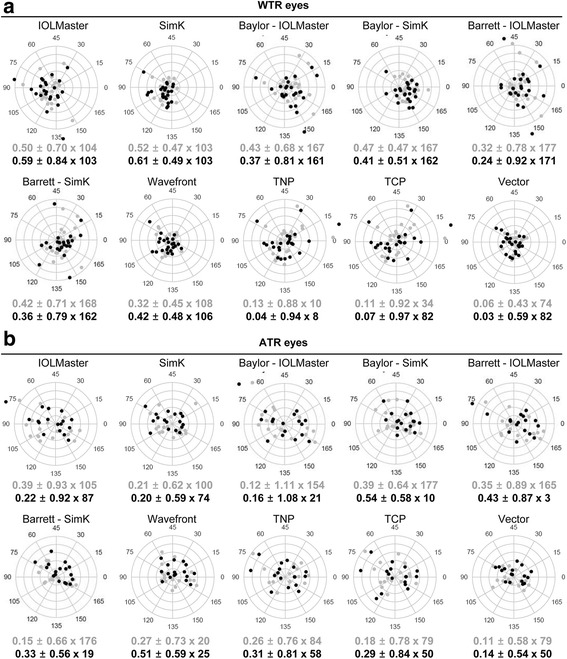
Fig. 2.

Double-angle plots of prediction errors in WTR (a) and ATR (b) eyes. Centroid errors in prediction errors at posteoperative 1- (gray color) and 3-month (black color) were shown. Each ring = 0.5 D (diopters). WTR = with-the-rule, ATR = against-the-rule, TNP = true net power, TCP = total corneal refractive power
